Written by: Valentin Stolbunov
Our mission statement
At the University of Toronto Sports Analytics Group, we aim to connect members who share an interest in the field. We also aim to support the analytics process and help members explore their own interests. Members can work together to find and manage data, to develop and test analytic models, and to present and publish their findings. Last but not least, we hope to connect members with industry professionals.
Our methodology
It is clear from our earlier introduction to sports analytics that Alamar’s structure of the sports analytics process is about feeding the decision makers. This is an indication of the place sports analytics has in a sports organization. However, because we do not operate within any particular organization, the structure needs to be revised slightly.
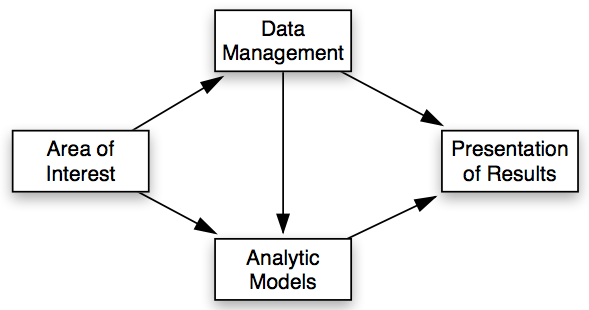
We do not have decision makers to whom we would provide our findings. Instead, our work is motivated by a question or a general area of interest. In many ways, this is similar to a coach asking the analytics team a question along the lines of “who is the best player we can sign for around $3 million?”. So instead of using a methodology that is designed to feed into a larger framework, we have altered the structure to instead begin with an element of motivation.
With no decision makers to facilitate, the information systems are no longer used to support the final element in the process. As the final element themselves, these systems must now focus on presenting the findings of the data and/or models in the same effective and efficient manner. Hence their new name: Presentation of Results. This presentation may be verbal (an essay-style argument that Player A is a better “scorer” than Player B), or visual (a visualization which shows the two players’ scoring habits), or both.
Our methodology will follow the sports analytics process above. A more specific, question-based, step-by-step process would look something like this,
- What is the area of interest we are looking to explore?
- Given (1), what type of data do we require? How do we best obtain and organize this data?
- Given (1) and (2), what type of analytic models, if any, should we use?
- Given (2) and (3), what is the best way to present our findings?
A basic example
Let us assume we were looking to determine who is currently the most dominant scorer in the NBA. This problem is ultimately as complicated as you would like to make it, but for the purposes of this demonstration we will keep it simple. The answers to our questions above would look something like this,
- Area of interest: offensive performances in the NBA
- Data required: points per game and field goal percentage this season
- Analytic models: none
- Presentation of results: rank players based on offensive data

A more advanced example
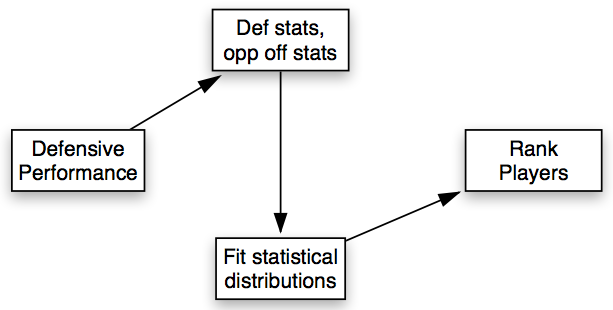
A more difficult problem would be determining the best “lock down defender” in the NBA. Some sort of model would probably be necessary this time and the answers would look something like this,
- Area of interest: 1 on 1 defensive performances in the NBA
- Data required: defensive statistics (steals, blocks) as well as change in opponent’s shooting percentage, preferably adjusted for opponent’s time on the court and
- Analytic models: obtain distributions for defensive statistics and the defender’s impact on the opposing player’s offensive performance
- Presentation of results: use average statistics to compare defending ability and variance of statistics to compare consistency, rank players