Written by: Valentin Stolbunov
Soccer, or football, or footy, or “the beautiful game” is the world’s most popular sport. When trying to prove this to a fan of North American sports, a soccer fan’s best weapon is usually global TV audience numbers. The 2014 Super Bowl had an audience of about 160 million viewers worldwide. The same year, the FIFA World Cup final had a global audience of about 1 billion. So, yeah, soccer is popular.
The recent sports analytics movement, however, didn’t originate from the world’s most popular sport. Most would agree it started with baseball and then spread to other North American sports – hockey, basketball, and football (the one with helmets). Compared to these sports, the use of advanced or “fancy” stats in soccer is still in the early stages.
History of Analytics in Soccer
Not much is known about the use of statistics in soccer before 1996. Older fans know that Arsene Wenger used a computer program during his time managing Monaco in the late 1980s. In any case, at this time clubs still relied heavily on their own data collection and storage methods.
In 1996, Opta began collecting match data for the English Premier League. This included all of the stats that a casual soccer fan is used to – number of passes, number of tackles, distance travelled, etc. In many ways Opta’s collection of this data was the starting point of what we now refer to as soccer analytics.
The use of stats was also headlined in 1999 when Bolton hired “Big Sam” Allardyce as their new manager. Legend has it Big Sam realized he couldn’t match the payrolls of bigger clubs and instead decided to hire a team of statisticians. They observed that the ball changed hands about 400 times in a single game, and that once a team lost the ball, quickly getting back into a solid defensive position was one of the best ways to avoid conceding goals. In addition, it is rumoured that Big Sam’s (often-criticized) direct approach is a result of the observation that about 30% of goals come from set pieces. By focusing more on set pieces, he was able to have Bolton score about 50% of their goals this way.
In 2003 Michael Lewis released Moneyball and its influence quickly spread across the Atlantic. The book’s release naturally started raising questions about the use of data in soccer. A couple of transfer market irrationalities were quickly exposed, most notably the salary/career length ratio for keepers and strikers and a strange bias towards recruiting taller players.
Fuelled by stats like Opta’s and the ideas of efficiency from baseball, analytics work from roughly 2003 until now has exposed many limitations in the popular stats. At the team level, a surprisingly low correlation was found between win percentage and metrics like the number of shots, possession, or number of passes. To this day, shot totals are used as some kind of proof that Team A played better than Team B. This however does little to explain the efficient tactics of clubs like Atletico Madrid, which take pride in limiting their opponents to a barrage of hopeful shots from outside the box while Atletico themselves focus on creating a handful of very good chances in the danger zone. At the player level, stats such as the number of tackles or distance travelled also didn’t seem to be very indicative of player quality. Nonetheless most of these are still used today in both TV broadcasts and journalistic work.
Data Collection and Availability
Basic data is widely available from your mainstream sports providers, like ESPNFC’s game stats pages. This includes historical match records and some basic player statistics. This type of data usually comes in the form of XML feeds or plain tables which one can simply copy/paste into a spreadsheet. Joe Kampschmidt has compiled a nice collection of data sources and types on his website.
The most sought after datasets in soccer are ones which contain the x, y positions of events on the pitch – passes, shots, tackles, etc. These are provided by companies like Opta and ProZone, largely behind a pay wall. Media sources such as Squawka source data from Opta for their infographics and visual/interactive match summaries. It is no secret that experienced programmers could do (and have done) some web scraping to obtain datasets such as these.
Modern Work
Modern soccer analytics work falls into three interesting categories:
- work done by clubs and data companies
- independent work done with publicly available data
- independent work done with commercial data
For obvious reasons, it is not always clear what the clubs are working on. However it would be safe to say that their work is focused on player performance and recruitment. Naturally, data companies also do a ton of analytics work. They are concerned with developing tools which can deliver statistical “insights” for any customer. A great example is Sky Sports and their partnership with Opta for those fancy gadgets that Gary Neville and Jamie Carragher are always playing with.
There is quite a bit of modern analytics work done with data that is publicly available. James Grayson has done a ton of work using TSR (total shots ratio), while Mark Taylor looked at TSR’s repeatability in other leagues. Dan Altman, who usually does work with commercial data, has also looked at quantifying league quality by using the player ages.
The most popular soccer analytics work in the public domain is done using commercial data. Possibly the biggest breakthrough came in the form of the expected goals model (ExpG or xG). Unlike in the sport of hockey, where one may argue every shot has a roughly equal chance of resulting in a goal (this isn’t exactly true but close enough), shots in soccer are more likely to result in goals if they are taken from a closer distance to the goal (among other factors). ExpG assigns a goal probability from 0 to 1 to each shot based on factors such as its distance and type. This makes the process of analyzing soccer fundamentally different from any other sport. There is a very high variance in the results (goals, wins) for a very complex system of inputs (passes, shots, player abilities).
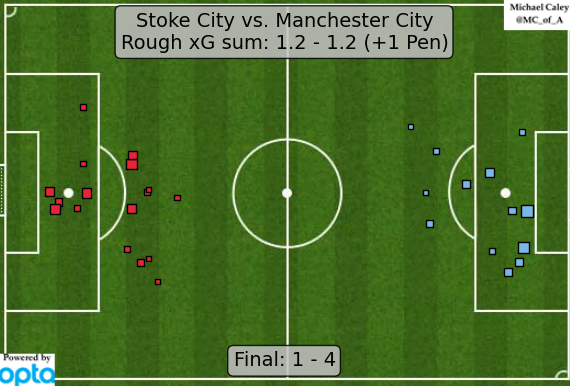
Michael Caley has described his ExpG model and prior to the 2014 FIFA World Cup used it to make some interesting predictions. Both Caley and Sander Ijtsma have in the past compared ExpG to metrics such as TSR for repeatability and predictive potential, concluding that ExpG is the best predictor for future performance. The expected goals model has become quite popular for quantifying over/under performance by players as well as developing interesting metrics such as expected assists. Michael Caley’s post-match ExpG infographics for the EPL (+ some other big games) have become somewhat of a staple in the analytics community on twitter. The following example, for a game between Stoke City and Manchester City, suggests a “fair” final score of about 1.2 – 1.2 (+ roughly 0.7 for the penalty). The immediate take away is that the game was fairly well-balanced in open play and by scoring four times, Man City were exceptionally clinical in front of goal.
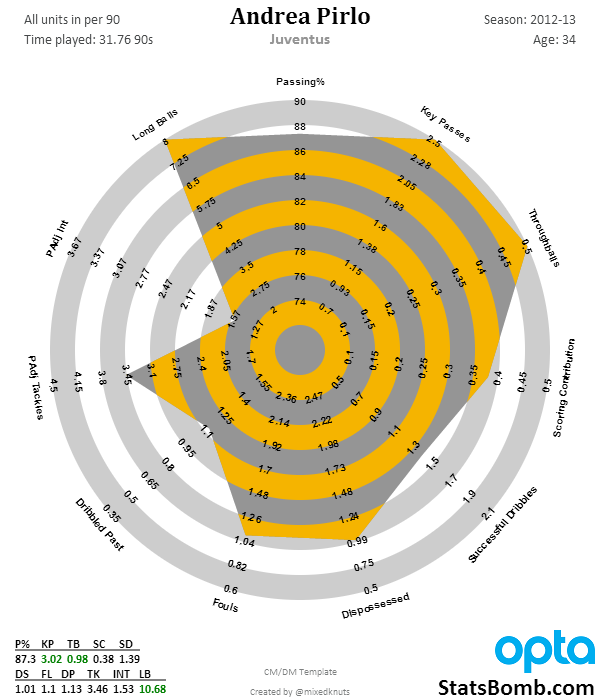
Commercial data has also helped with a number of other interesting developments. By applying local regression to the series of location-based time-stamped events in Opta data, Constantinos Chappas and Colin Trainor were able to create animated player positional trackers and look back at the location and influence of players throughout the course of a game. Another popular development has been the “radar” used by Ted Knutson to visualize player performances over season-long stretches. Ijtsma has also looked at radars, and a small web tool has since been developed for creating your own. Here is an example of Knutson’s radar for Andrea Pirlo’s 2012/13 season at Juventus. The inner and outer bounds for radars such as these are typically determined by the 5th/10th and 90th/95th percentiles of all players in the database. The categories vary depending on the template for various positions (because using goals to determine the quality of a defender doesn’t make too much sense). Ultimately the idea behind this type of visualization is that a “complete” player should cover a large percentage of the radar’s area.
Although soccer analytics has been the topic of a few presentations at Sloan, most state-of-the-art projects and techniques (within the public domain) have been presented at the Opta Pro Analytics Forum. The 2015 event had interesting presentations on everything from identifying player types for scouting to classifying playing styles. Mark Taylor, one of the invited speakers, wrote about his experience at the forum here.
Modern soccer analytics work has also not gone unnoticed by journalists at various media outlets. Toronto’s own Richard Whittall has for a long time used the latest and greatest analytics resources in his articles for theScore, ESPN, and The Guardian. Meanwhile another Canuck, Sam Gregory, has recently started writing analytics-themed footy articles at Sportsnet. Mike Goodman has also been known to use a fancy stat or two (or many) in his contributions, usually for The Triangle at Grantland.
List of Resources
The articles I have linked to thus far cover a decent chunk of the modern soccer analytics work. In fact, Tom Worville recently wrote a similar piece about two months ago, where he also links to a good collection of work. Before I dive into a list of other cool articles from the past 8 months or so, I should mention that the soccer analytics community is very active on twitter. UTSPAN’s own twitter list for soccer is a good collection of accounts to follow, as is the longer list of Neil Charles, who has recently updated his very cool network graphic of football analysts.
Demonstrations and guides:
- Google I/O 2014 – predicting the future with the Google Cloud platform
- Predicting football using R
- How to do football analysis in Tableau
Summary articles:
- Four years in football analytics
- This tear in analytics: 10 influential works from 2014
- Analytics changing way we interact with soccer
Technical articles:
- Stat definitions by Statsbomb (and every other article there)
- Expected goals 2.0 – some light in the black box
- What is expected goal difference? It’s complicated
- Shot quality, shot quantity, and tactics
- Expected goals from situations
- What should go into player ratings?
- The importance of attacking speed and the quickest attacking team in EPL
- Who’s good and who’s bad in the Premier League (by ExpG)?
- Analysing football styles
Media articles:
- Can statistics explain soccer? (2008)
- The adolescence of soccer stats
- How Bolton Wanderers are revolutionising the use of data analysis in football to win back their Premier League place
- Germany’s 12th Man at the World Cup: Big Data
- Billy Beane can’t get enough of soccer after revolutionising baseball
- The people tracking every touch, pass, and tackle in the World Cup
- Why analytics and ingenuity only add to football’s romance
- The dangers of football statistics
One thought on “Introduction to Analytics in… Soccer”
[…] Update 28/02: A more in-depth introduction to Football Analytics written by Valentin Stolbunov can be found here. […]
500 words on….what is Football Analytics and how can I get involved? | Analytics FC
Comments are closed.