Written by: Valentin Stolbunov
Defining: Analytics
Before jumping to Google and adding “wiki” to the end of my search query, I thought I’d try to define analytics myself. When I think of analytics, I usually think of finding patterns in data and using those patterns to answer questions. Wikipedia says I am not too far off:
Analytics is the discovery and communication of meaningful patterns in data.
The important thing to note at this point is that analytics is a process. In fact, it is an interdisciplinary process which usually brings together mathematics, statistics, computer science, predictive methods, data visualization, and other fields of study.
It is also important to note that analytics relies on the presence of data. This ultimately differentiates the term from “analysis” and unfortunately creates confusion when trying to decide if what you are doing is analytics or “data analysis”. For our intents and purposes, the two are essentially the same process. However, the field has been dubbed “sports analytics” and not “sports data analysis”, so we will accept the name and move on.
Before continuing to the sports side of things, it should be noted that the term “analytics” may also be used to describe the results of this process. For example, “the analytics of our last project suggest that…” is a perfectly valid sentence. However, in my experience I find that here it is best to just replace “analytics” with “analytical findings” or “results” and reserve the term “analytics” for the process through which these results are obtained.
Defining: Sports Analytics
This is where Wikipedia does not offer much help – nor does it need to. Sports analytics is essentially the analytics process, as described above, applied to sports.
It is the process of using sports-related data (anything from player statistics to game day weather) to find meaningful patterns (strong correlations, hidden trends, etc.) and communicate those patterns (using graphs, charts, essays, etc.) to help make decisions.
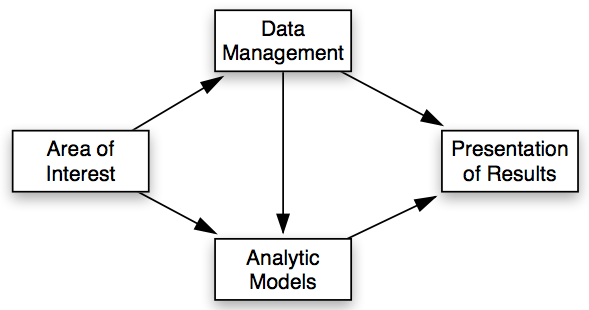
In his book, Benjamin Alamar presents a helpful graphic to illustrate the overall sports analytics process. In his framework, sports analytics consists of four elements: data management, analytic models, information systems, and the decision maker.
I have done my best to provide both Alamar’s definition of each element and my own thoughts on their uses and values:
- Data management: This includes any and all processes associated with acquiring, verifying and storing data. The data management element is ultimately about facilitating the modelling and information-extraction elements. As mentioned earlier, you can’t have analytics without data.
- Analytic models: This element is essentially the process of applying statistical tools to data. The use of models to “forecast” player or team performance is often the most popular goal, but it is by no means a necessity. The models may or may not offer insight into the future. It is most accurate to say that they are concerned with using mathematics and statistics to describe the data.
- Information systems: Unlike the previous two elements, the information systems are slightly more abstract. The purpose of these systems is to extract and present the data and/or model results as effectively and efficiently as possible. A scouting report is a good basic example.
- Decision makers: The end goal of analytics is to extract relevant and insightful information from the data and present it to the decision makers. In modern sports these tend to be the coaching staff or management, however, players themselves may also benefit from the whole process.
What is the history of the field?
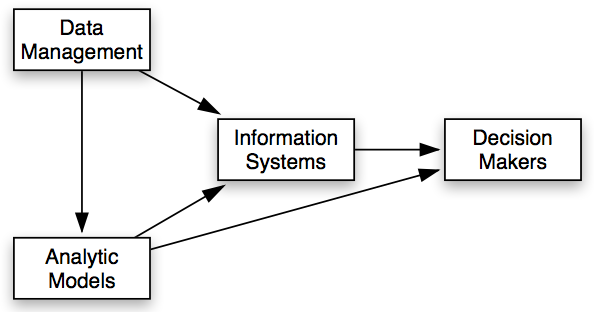
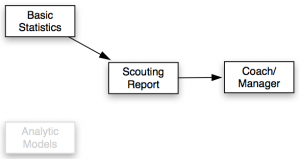
Although many professionals believe that modern model-heavy sports analytics is at a point of exciting growth, the field of sports analytics is by no means new. Technically speaking, any time anyone has ever used data to make a decision related to sport, they were conducting analytics. However, the general consensus is that sports analytics began sometime in the 19th century with baseball. The data (basic statistics such as hits and pitches) was collected with good old pencil and paper. It was then used create scouting reports which a coach or manager would use to make decisions about their team.
Referring back to Alamar’s graphic of the entire process, this type of analytics would lack a modelling element but still follow a logical flow toward the decision maker. These 19th century baseball decisions to be made were perhaps fewer and less detailed, but not necessarily easier.
What is the current state of the field?
We now have two things which we didn’t have in the 19th century of baseball analytics. The first of these is more sports nerds. Sports have grown in popularity and fans have become much more demanding of information. More often than not sports arguments include statistics, even if they are about whether or not “number of rings” is a statistic. Everyone and their parents have a fantasy team and compulsively refresh Twitter in hopes of finding out how long Derrick Rose will be out for this season.
The second thing we now have, which in some ways overlaps with the first, is more data. The recent advances in technology have affected just about every aspect of life, and sports is no different. The following things have all contributed to the recent growth in the field:
- The improvements in computing power and digital memory
- The increased quantification of our world (aka the ultimate buzzword: “big data”)
- The advances made in solving complex engineering problems like vision and inference
Modern sports analytics uses database management systems and things like SQL where pen and paper were once the norm. Analytical models from machine learning and data mining are now used to help sort through the data and find patterns. Models are now updated in real time and together with innovative visualization techniques are the new breed of information system.
With more data, and more people interested in sports analytics, organizations are doing their best to gain every possible advantage in every aspect of sports from training routines to player recruitment and valuation.
What does the future hold?
The field is growing.
More and more sports organizations are hiring analytics “teams” and “departments”, usually composed of professionals with STEM (science, technology, engineering, mathematics) degrees. The media appears to be following suit by recruiting data science professionals to find and visualize the unique trends that their viewers want to see. There is no reason to believe that these new opportunities will stop popping up or disappear all together.
In addition, social media has helped connect fans and form communities of the analytically-inclined. Whether out of personal interest or in hopes of being noticed, more fans will create stats-based blogs and continue to explore the numbers of their sport.
The field has also not gone unnoticed in academia. If conferences like MIT’s Sloan, journals like Quantitative Analysis in Sports, and new courses offered by top universities are any indication, institutions have noticed the growth in sports data and are interested in conducting research in the field.
Sports analytics is sometimes discounted as just an invention of weird metrics. But it is much more than that. From engineering solutions in data, like SportsVu, to innovative information systems, like shot charts, the future of the field is in ultimately working to advance each step of the whole process.