Written by: Kurtis Judd
Whether you’re simply interested in following home run races, or using programming languages to predict next year’s MVP, it’s hard to argue that baseball isn’t a statistics driven sport. Every event in the game is so discrete, that it’s a statistician’s dream of clean, easy to work with data.
History of Analytics in Baseball
Anyone who follows baseball has heard the term “sabermetrics”. Bill James is arguably the father of baseball analytics and defines sabermetrics as “the search of objective analysis of baseball.” The word comes from the acronym SABR (Society for Analytics in Baseball). In general it’s the use of statistical analysis to question long held beliefs about the sport.
For the most part the tinder that started the analytical fire were Bill James’ abstracts that he began writing back in 1977 which took a unique look at the game from a quantitative statistical perspective. His abstracts were somewhat dismissed by the very traditionalist baseball community at first, but by 2002, Bill James was working as a consultant for the Boston Red Sox. That team would not only break the dreaded “Curse of the Bambino” in 2004, winning their first World Series since trading Babe Ruth in 1918, but would win championships in 2007 and 2013 as well. Michael Lewis’ 2003 book Moneyball shed some light on the strategies that the Oakland Athletics and general manager Billy Beane used to make multiple playoffs appearances on a shoestring budget. By then, the blaze of the analytics revolution could finally be sustained. The way we followed all sports not just baseball, changed forever.
Run Creation
To build the basis for understanding advanced baseball statistics it’s important to understand one crucial, intuitive relationship: Run differential correlates very strongly with wins. Analytics in baseball is basically built around this premise.
In any at-bat, there can be 0-2 outs, and each base can either be occupied or empty making for a total of 24 different possible game states. From there, obviously, the more people on base and the fewer the outs, the higher run expectancy. You can compute run expectancies for a given season using a play-by-play database, and finding out the average runs scored for the remainder of an inning after each game state. To then find a run value for each hitting event (i.e. single, home run, etc.) you use the following formula [1]:

Most advanced statistics in baseball build off this formula in order to better link a player’s performance with his team’s.
Advanced Hitting Stats
Traditional baseball stats include things like batting average, home runs, and runs batted in. Throughout baseball history these have been the statistics upon which the game’s superstars have been compared. The problem with a rate statistic like a batting average is that it leaves out the value of walks, while also weighing doubles, triples, and home runs the same as a single. Stats like slugging percentage (total bases/at bats) and OPS (on-base percentage plus slugging percentage) attempt to adjust for this, but still overvalue extra-base hits. When it comes to hitting, there are a few statistics that do an excellent job of relating the effect of each hitting event to its run value to provide excellent all-encompassing metrics.
wOBA (Weighted On-Base Average): wOBA works by providing weights for each traditional hitting statistic to provide a comprehensive hitting statistic. The calculation is quite simple (coefficients are from the 2014 season, taken from Fangraphs.com):

The coefficients in the equation are simply the average run values of each event. They change each year, as the mean run values for each event change. Each term is also multiplied by a scaling factor which serves to adjust the league average wOBA to the league average OBP for that year, so a good wOBA reads just like a good OBP, .400 being great, .315 being about average, and .280 being pretty bad.
wRC and wRC+ (Weighted Runs Created): wRC is the latest advancement of Bill James’ initial runs created (RC) stat. RC simply multiplied a rate statistic such as OPS by a player’s plate appearances to provide a counting stat estimate of how many runs a player provides to his team. wRC does the exact same thing, except it uses wOBA as the rate statistic. wRC is calculated as follows (equation from Fangraphs.com):
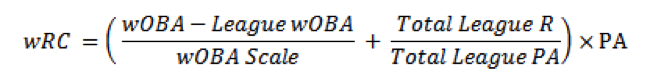
Another stat used at times is wRAA (Weighted Runs Above Average). wRAA does not include the League R/League PA term, meaning it is scaled to league average, whereas wRC is scaled to zero. wRC+ is a further tweaking of wRC applying park and league adjusting factors calculated as follows (equation from Fangraphs.com):
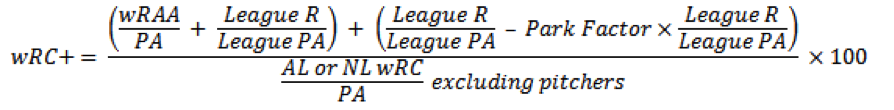
While wRC is a counting statistic, wRC+ is a rate statistic, where a player is compared to the average player in his league. The Park Factor term applies to a player’s home ballpark. A park factor greater than 1 indicates a hitter’s park, and adjusts a player’s wRC+ down if he plays his home games in a hitter’s park, and vice versa. A league average player will have a wRC+ equal to exactly 100, making it relatively easy to compare players using this metric. For example, a player with a wRC+ of 120 is 20% better than a league average player. You can plug any rate statistic into the wRC+ equation in the same way wOBA is used here to get park and league adjusted numbers. ERA and OPS are two other statistics that are sometimes used in this way, giving ERA+ and OPS+.
BABIP (Batting Average on Balls In Play): This is a statistic that can be applied to either hitters, or to pitchers in the form of batting average against. BABIP is just a batting average that doesn’t include strikeouts, walks, home runs, or getting hit by a pitch. Voros McCracken of baseballprospectus.com showed that the amount of hits that fall in against pitchers does not correlate season-to-season [2]. Therefore, BABIP is often used to determine how lucky a particular hitter has been over a relatively small sample size of at-bats. If a player has a stretch where his BABIP is way above his career average, his numbers may see a dip in the near future as his BABIP regresses to the mean.
Baserunning and Fielding: The two main base-running advanced metrics in circulation are UBR (ultimate base running) and wSB (weighted stolen bases). Both use linear weights calculated from run values, and are essentially the baserunning and stolen base equivalent of wRAA, meaning they are scaled to league average. UBR does not include stolen base and caught stealing events, focusing instead on the value a player provides in things such as taking an extra base that most players don’t take, tagging up and advancing or not on a flyball, and hitting into double plays. wSB accounts for stolen base events, and ignores the other stuff.
Up to this point, there really isn’t a good catch-all defensive metric that is completely objective. Unlike total errors and fielding percentage, which neglect a player’s range, stats like Ulitmate Zone Rating (UZR) and Defensive Runs Saved (DRS) assign fielders “zones” in an attempt to determine how many runs a player saved or cost his team by factoring in range, outfield arm strength, and a fielder’s ability to turn a double play. One problem with these stats is their failure to account for positioning. If a player is not in the centre of his “zone” this will skew the data, and presents a real problem when teams employ overly aggressive defensive shifts [3]. Brett Lawrie often saw spikes in his UZR due to being deployed as a shallow right fielder against left-handed pull hitters despite being a third baseman. Despite their flaws, UZR and DRS have been the state-of-the-art among defensive metrics for a while prior to the advent of FIELDf/x, which I’ll talk about later. If you would like to learn more about these metrics, visit Fangraphs.com for a good UZR primer, and check in at Fielding Bible for a comprehensive explanation of DRS.
Advanced Pitching Stats
While hitting statistics are a bit cut and dry, it’s more difficult to use data to tell if a pitcher is any good. A pitcher’s statistics are very much dependent on how well the defence behind him plays, so because of this, many of the advanced pitching statistics are based off statistics that don’t include the defence.
FIP and xFIP (Fielding Independent Pitching): Almost the opposite of BABIP, FIP uses the statistics which the pitcher has sole control of to provide a better estimate of his value in isoluation . It is calculated in the following way (from Fangraphs.com):
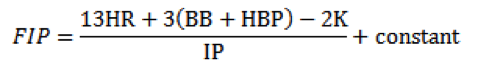
The constant in this equation serves to adjust FIP to the same scale as ERA. When analyzing a pitcher’s FIP, if it is lower than his ERA, he’s been getting bad luck on balls in play, and his numbers should improve as his luck turns around. FIP works as a simple, yet effective predictive metric for pitchers. xFIP is a slight improvement on FIP where the HR number is generated by applying the league average HR to fly-ball ratio to a pitcher’s fly-ball rate to give an estimate of how many home runs a pitcher should have allowed.
SIERA (Skill-Interactive ERA) is another pitching metric that also includes ground ball rate, while stripping out park factors. It’s a little much to get into here, but read more about it at Fangraphs.com if you’re interested.
WAR (Wins Above Replacement)
WAR is an attempt to include a player’s total value (hitting, fielding, baserunning, and pitching) in one catch-all statistic. Based on the relationship of runs to wins, 10 runs is usually worth about 1 win. As we’ve seen you can estimate how many runs a hitter provides due to his hitting, baserunning, and fielding, and thus can also calculate the amount of wins he provides. This number is compared to a replacement player, which is essentially a cheaply available player that could be signed for a minimum salary or called up from the minor leagues. The definition centres on the fact that a team full of replacement players would win 47.7 games [4]. A replacement level player would provide 0 wins, while and MVP candidate will be anywhere from 7-10 wins. There is also the potential for a player to be so bad, that he’s below replacement level. Use WAR with caution, as with any statistic. In my experience, I’ve found it to really overrate some players due to the more error prone defensive metrics. For example, Royals left fielder Alex Gordon, an excellent player in his own right, was fifth overall in WAR, which is a stretch. He’s an excellent defender, who plays a position typically manned by plodding, all-bat type players, so he gets more love from the defensive metrics than your typical center fielder or shortstop. Even though players at that position may be good, or better defensively, the average defenders at those positions are at a different level than the average left fielder.
WAR for pitchers is a little more involved. Fangraphs.com and Baseball-Reference.com are the two sites that calculate WAR. They both use different metrics for pitchers with Fangraphs using a calculation that centres around FIP, and Baseball-Reference using a pitcher’s total earned runs, accounting for opponents, team defense, park, and role [3]. Additionally they also use different defensive metrics, Fangraphs using UZR, and Baseball-Reference using a stat called Total Zone.
Interesting Technologies
PITCHf/x: PITCHf/x is a product of Sportvision, a company that produces the virtual first-down line that’s become a fixture on every football broadcast, and in the past brought us the infamous FoxTrax glowing hockey puck (insert American hockey broadcasting joke here). Since 2005, MLBAM (MLB Advanced Media) has used PITCHf/x to provide baseball fans with comprehensive information on each and every pitch thrown. It provides a well laid out graphic through the Gameday application on MLB.com, showing fans each pitch in real time from the bat catcher’s perspective. Two cameras installed in every major league park track the flight of the baseball from the pitcher’s hand to home plate, while advanced software calculates the position, velocity, and acceleration of the ball. From this information the software is able to calculate information such as the overall horizontal and vertical movement of the pitch, the break angle and break length, as well as the spin direction and spin rate. In addition to these parameters, PITCHf/x uses an algorithm to estimate what kind of pitch was thrown (fastball, curveball, slider, etc.) [1]
Additionally, PITCHf/x provides pitcher, batter, and event information, so it can be used to answer questions such as which batters fare the best against curveballs, or whether or not James Shield’s velocity been decreasing over the last 3 years. All PITCHf/x raw data is freely available on the MLB.com website, though it exists in the somewhat difficult to handle XML format. If you’re using R, a friendly guy named Carson Sievert has created the pitchRx package, which scrapes the data from the MLB website and can be called to an array with the following simple lines of code [1]:
library(pitchRx)
dat <- scrape(start = "2012-05-31", end = "2012-06-01")
It took almost 10 minutes to scrape this data onto my computer, which only amounts to 2 days’ worth of games! So, as mentioned in the databases section if you know what you’re looking for, it’s way easier to use baseballsavant.
FIELDf/x: FIELDf/x equipment is another Sportvision production, attempting to finally provide the baseball world with objective fielding analysis. Unlike PITCHf/x, FIELDf/x data is not currently publicly available. While PITCHf/x will spit out about 250 observations a game, FIELDf/x could provide over 1 million, some of which is information about a player trotting back to his dugout. Handling multiple games or even seasons and separating the interesting data from the crap, will definitely be difficult to handle on today’s personal computer. It’s unknown if MLB or Sportvision make this data more presentable and useful before issuing it to teams, or if teams are building the infrastructure to handle it on their own; a step that would be important at some point for amateur analysts to be able to use FIELDf/x data efficiently. Fangraphs has an interesting article where they discuss the pros and cons of this data going public, discuss the data storage challenges, and explains the system in further detail.
Databases
If you want to do some of your own analysis (which is the point of this group right?), the baseball analytics community is very open with their data. There are lots of great databases to choose for whatever you’re looking for:
The Lahman Database: http://seanlahman.com/baseball-archive/statistics
- Provides season-by-season data for every player who’s ever played in the big leagues.
- Also provides salary information, past award winners, hall of fame voting results, and even player biographies.
- Available in .csv, Microsoft Access and SQL versions.
The Retrosheet Databases: http://www.retrosheet.org/
- Includes game logs going back to 1871, and play-by-play data back to 1921, though the play-by-play stuff has some gaps.
- Available in comma-delimited form.
Baseball Savant http://www.baseballsavant.com
- Has a number of cool applications, where you can compare players and their spray charts, among other things.
- Perhaps the most useful thing about this site is that the author has organized PITCHf/x data in a really good way, so that you can recover information simply on a given pitcher or pitch type, etc. in the form of .csv file.
Fangraphs: http://www.fangraphs.com/
- You can export the data from any Fangraphs leaderboard to a .csv file, and better yet, the drop down menus make it easy for you to sort which type of data you want. Their leaderboards also include a bunch of advanced statistics which aren’t available on other databases.
In addition to all the data, the site contributors are always posting interesting stats-based articles.
[1] Marchi, M. and Abbott, J. Analyzing Baseball Data with R. CRC Press, Boca Raton, FL, 2014.
[2] V. McCracken. “Pitching and Defense – How Much Control Do Hurlers Have?” http://www.baseballprospectus.com/article.php?articleid=878, January 23, 2001 [Feb. 6, 2015].
[3] “The Real Problem with Baseball’s Defensive Stats.” http://www.sports-reference.com/blog/2014/09/the-real-problem-with-baseballs-defensive-stats/, September 4, 2014 [Feb 10, 2015].
[4] Graham MacAree. “Replacement Level.” http://www.fangraphs.com/library/misc/war/replacement-level/, [Feb 10, 2015]