Wednesday, Mar 20th , 2024 8pm-9pm EDT
Hassaan Inayatali
Resources:
Wednesday, Mar 20th , 2024 8pm-9pm EDT
Hassaan Inayatali
Resources:
Wednesday, Mar 13th , 2024 8pm-9pm EST
Jaden Majumdar
Resources:
https://drive.google.com/file/d/1yq7y3LclUR4XB5uVnFfil82kXkTmLcl6/view?usp=sharing
and https://drive.google.com/file/d/17avHxCNfkjjt0e5XHkg6dGelmJ0uSNLc/view?usp=sharing
Wednesday, Mar 6th , 2024 8pm-9pm EST
Daniel Hocevar
Resources:
https://colab.research.google.com/drive/1R-z16sabX1gOx24ieIZ9rLcSusl48rQp?usp=sharing
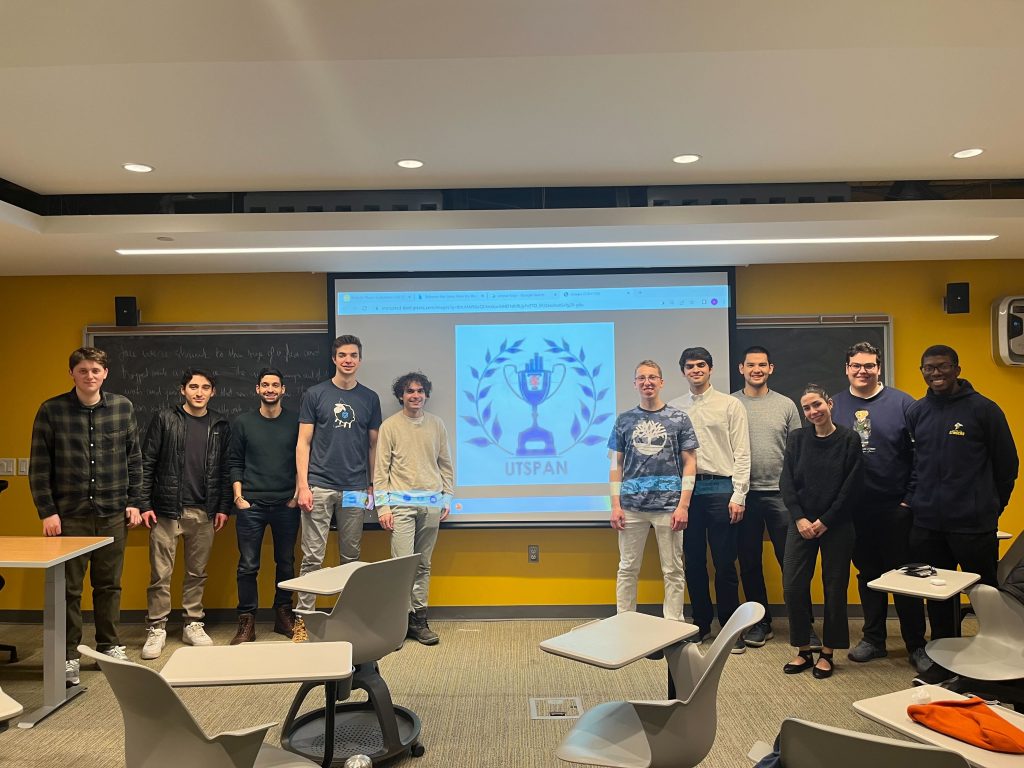
Members of the UTSPAN community got together for our largest showcase ever to present captivating sports analytics projects that they have been working on.
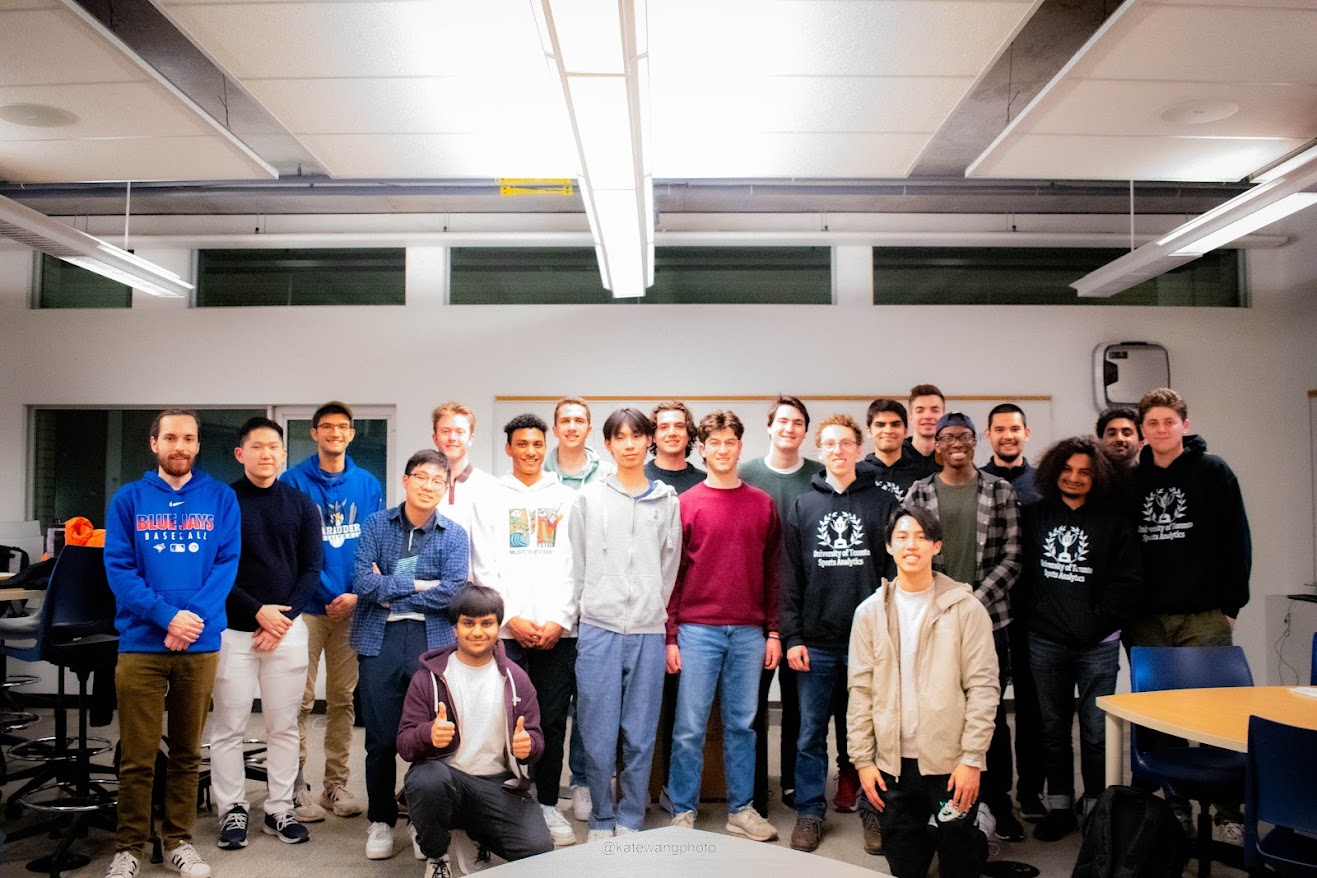
Our showcase took place on March 27th, from 6-9 pm at the Bahen Centre for Information Technology, at 40 St George St, Toronto, Ontario in room BA2145. The presentations that occurred are listed below:
SMT Data Challenge: This Isn’t a Stretch: Quantifying Ball Acquisition Proficiency to Evaluate Fielders on Assisted Put-Outs. This project won $1000 as winners of the Graduate Division. Authors: David Awosoga, Aaron White, Daniel Hocevar, Jaden Majumdar. University of Toronto, University of Waterloo.
2024 Big Data Cup: Zone Entries. Authors: Zeke Weng, Samarth Sharma, Daniel Du, Alexander Khan. University of Toronto
2024 NFL Big Data Bowl: Every Step You Take: Measuring A Defender’s Moves. This project won $5000 as runners-up! Authors: Hassaan Inayatali, Aaron White, Daniel Hocevar, Jaden Majumdar. University of Toronto.
2023 Linköping Hockey Analytics Conference: Comparing Defensive Pressures Using Possession Retention Probability and Expected Goals. This project was a finalist for the student competition! Authors: David Awosoga, Justin Cue, Aujin Li, Jaden Majumdar, Juno Wang. University of Toronto, University of Waterloo
NBA Player Scorecards. Author: Fauzan Lodi, University of Waterloo
Evaluating Player Influence in the National Hockey League using Player Puck Tracking Data. Author: Hassaan Inayatali, University of Toronto.
NHL Positivity Index. Authors: Jacob Winch, Tanmay Munjal, Heiby Lau, Alexander Bradley, Yukesh Subedi, Arden Monaghan, William Luo. University of Alberta.
2024 NFL Big Data Bowl: Tackles Above Average. Authors: Jacob Winch, Colton Schneider, Siddhartha Chitrakar. University of Alberta.
2024 Big Data Cup: Special Teams. Authors: Victor Hau, Jason Alizadeh, Kishan Vethanayagam, Matthew Braho. University of Toronto.
2024 NFL Big Data Bowl: Tackle Redistribution: ‘T’ in Tackle is for Team. Author: Zeke Weng. University of Toronto.
Wednesday, Feb 28th , 2024 8pm-9pm EST
Aaron White
Resources:
https://colab.research.google.com/drive/1SmQSABg5IDG269syL_2pwM86axClT8ty?usp=sharing
Wednesday, Feb 14th , 2024 8pm-9pm EST
Hassaan Inayatali
Resources:
https://github.com/hinayatali9/SSAC_2021/blob/main/Draft_Trades_Analysis.ipynb
Congratulations to Hassaan Inayatali, Aaron White, Jaden Majumdar and Daniel Hocevar for finishing as a runner-up in the National Football League (NFL) Big Data Bowl, winning $5000 for their project. It can read from here: https://www.kaggle.com/code/hassaaninayatali/every-step-you-take-measuring-a-defender-s-moves
Check out Zeke Weng’s NFL project, read from here: https://www.kaggle.com/code/zekeweng/tackle-redistribution-t-in-tackle-is-for-team
Yiru Wang, Navraj Brar’s NFL project, read from here: https://www.kaggle.com/code/yiruwang02/missed-opportunities-defining-and-assessing-misse
Wednesday, Feb 7th, 2024 8pm-9pm EST
Ethan Baron
Resources:
Wednesday, Jan 31st , 2024 8pm-9pm EST
Hassaan Inayatali
Resources:
https://colab.research.google.com/drive/13grnTJeeL9EMUaIiUr4yDUM0JvTzmnFf#scrollTo=92HJVFoTlU9J
Wednesday, Jan 24th , 2024 8pm-9pm EST
Jaden Majumdar
Resources:
https://colab.research.google.com/drive/1yJAGSbvaQAythlpC3HB5_ArA5YgOAzgJ?usp=sharing
Wednesday, January 17th, 2024, 7pm EST
BRENDAN KUMAGAI (Data Scientist in Zelus Analytics’ Hockey Research & Development team)
Check out his winning submission:
https://www.kaggle.com/code/bkumagai/bayesian-velocity-models-for-horse-race-simulation
Wednesday, Nov 29th, 2023 7pm-8pm EST
Daniel Hocevar
Resources:
https://colab.research.google.com/drive/121tjjXLdGBrMdgylwzw9SERPTdcHICKl?usp=sharing
Wednesday, Nov 22nd, 2023 7pm-8pm EST
Aaron White
Resources:
https://colab.research.google.com/drive/1EF6QS_6bYTwoXshz9qoF9hNE892zk8Ba?usp=sharing
Wednesday, November 15th, 2023, 7pm EST
Dr. David Radke (SR RESEARCH SCIENTIST WITH CHICAGO BLACKHAWKS)
Check out the slides from the seminar:
https://drive.google.com/file/d/1z-3xeY-PuL-nOv5QR3CPWBCNwpC6v400/view?usp=sharing
Multiagent systems is a sub-field of artificial intelligence (AI) concerned with how multiple agents interact in an environment. In the first part of this talk, Dr. David Radke presented methods to characterize the available passing space between any two players using NHL puck and player tracking data. In the second part of this talk, Dr. David Radke discussed some of the ways researchers anticipate multiagent systems will be used to revolutionize team sports analytics in sports classified as “invasion games” (i.e., ice hockey, basketball, and soccer). Success in invasion game sports requires high degrees of inter-player coordination and cooperation. Dr. David Radke made connections between areas of research in multiagent systems and existing problems in team sports analytics, and in turn, show how sports will help drive multiagent systems research forward.
Congratulations to UTSPAN members David Awosoga, Daniel Hocevar, Jaden Majumdar, and Aaron White on being named winners of the graduate student division of the 2023 SMT Data Challenge after their presentation at the Carnegie Mellon Sports Analytics Conference on November 11th.
Their submission develops a framework to evaluate catch difficulty on throws to first base. Check out their work at https://github.com/danielhocevar/SMT-Baseball-2023.
Wednesday, Nov 1st, 2023 7pm-8pm EST
Ethan Baron
Resources:
https://colab.research.google.com/drive/14fmLTMpqW-folgLbHeIKS2n5wH-mo3t7?usp=sharing
Wednesday, October 25th, 2023 7pm-8pm EST
Jaden Majumdar
Resources:
https://colab.research.google.com/drive/1DHzqY96vTs8Pzotc9e6IHsP-x5PvzFPf?usp=sharing
Wednesday, October 18th, 2023 7pm-8pm EST
Hassaan Inayatali
Resources:
https://colab.research.google.com/drive/1H0uo4px82diHFnsHKw5TgLC266PVjHDQ?usp=sharing
Wednesday, October 11th, 2023 7pm-8pm EST
Aaron White
Resources:
https://colab.research.google.com/drive/1e4bFJvsifyuRMWVX_zBkFgf3cUABvONB#scrollTo=fyhy1FGO5_k4
Wednesday, October 4th, 2023 7pm-8pm EST
Daniel Hocevar
Resources:
https://colab.research.google.com/drive/19D6vSgy3wGsckDgb3xO8ds3kBT-6luKl?usp=sharing
Wednesday, September 27, 2023 7pm-8pm EST
Hassaan Inayatali
Resources:
https://colab.research.google.com/drive/1CmpLm4Od8K-arzpwnEr8uADHhCxzxUjr#scrollTo=6rLfqDPshwD5
Congratulations to UTSPAN members David Awosoga, Justin Cui, Aujin L., Jaden Majumdar, and Junhao Wang for being selected as finalists for the 2023 Linköping Hockey Analytics Conference Student Competition!
They will present their submission, titled “Comparing Defensive Pressures Using Possession Retention Probability and Expected Goals”, at the Linköping Hockey Analytics Conference this June, held at Linköping University in Linköping, Sweden!
Their work develops a possession-based event valuation framework to contrast the impact of stick checks, body checks, and puck protections on scoring chances. Check it out here.
Wednesday, March 29, 2023 8pm EST
Hassaan Inayatali
Resources:
https://colab.research.google.com/drive/1e9zAckbAeNOx8hNf7Kuq3NhIINOyyIMl?usp=sharing
Wednesday, March 22, 2023 8pm EST
Bill Nguyen
Wednesday, March 15, 2023 8pm EST
Ismail Benchekroun
Resources:
https://colab.research.google.com/drive/1FcRWp3UiRshDK2stzT0u7QXXgdG7uwrB?usp=sharing
https://docs.google.com/presentation/d/185ATJdxkNjShxuB9HFt8KxKGuHFbBR1aqA01WnBDFno/edit#slide=id.p
Wednesday, March 8, 2023 8pm EST
Hassaan Inayatali
Resources:
https://colab.research.google.com/drive/12qk8_PVBi-2O5CeTO272x_g4zKF_YNUQ
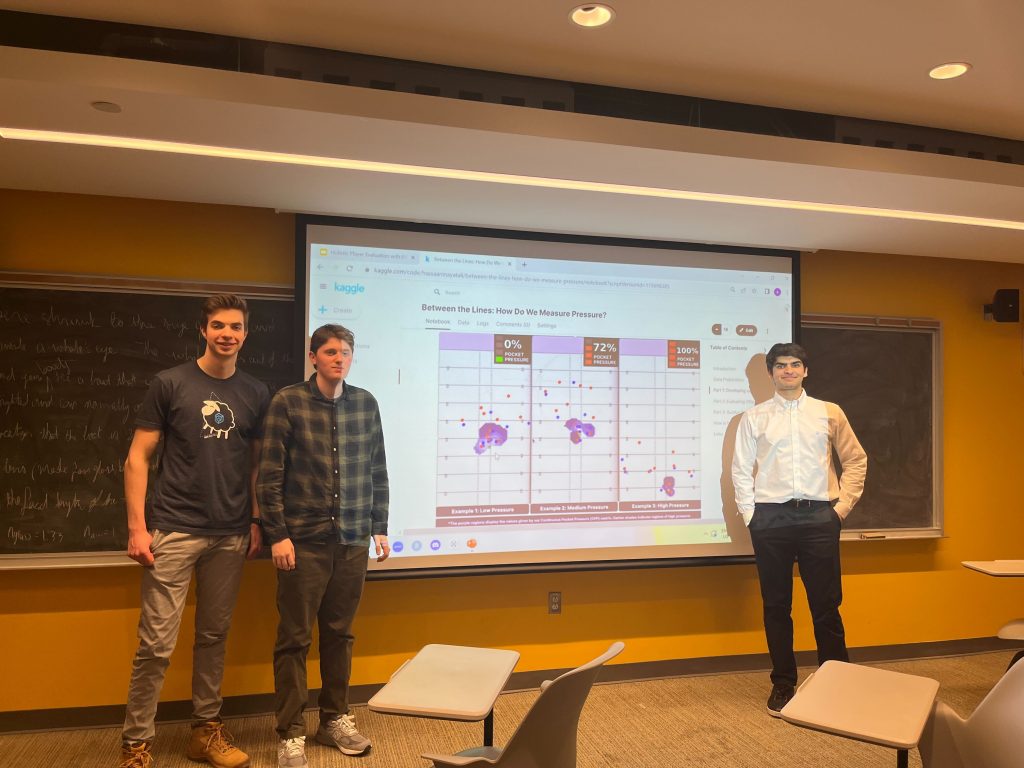
Congratulations to UTSPAN executives Hassaan Inayatali, Daniel Hocevar, and Aaron White on being named the overall champion for the 2023 Big Data Bowl!
Their submission develops a new way to measure pressure on the quarterback over the course of a football play using player tracking data. Check out their work at https://www.kaggle.com/code/hassaaninayatali/between-the-lines-how-do-we-measure-pressure.
The group presented their submission at the NFL Scouting Combine in Indianapolis on March 1st and have won $30,000 in prize money for winning!
The Big Data Bowl, hosted each year by the NFL on Kaggle, is arguably the world’s most prestigious sports analytics competition. UTSPAN’s submission was included among 8 finalists from almost 300 submissions!
Wednesday, March 1, 2023 8pm EST
Ethan Baron
Resources:
https://docs.google.com/presentation/d/1F-EP4zfTyAFkJOC6n-IKMYRIQ1YWlOPshK95NQQIW1M/edit#slide=id.p
https://colab.research.google.com/drive/1sCxf_D6lhLC6heHYFE9xxav_5n8pkykZ?usp=sharing
Members of the UTSPAN community got together to present captivating sports analytics projects that they have been working on.
The program was:
6:10pm – 6:30pm
Hayden Groer, Bhanu Mamillapalli, Daniel Lim, Siddhi Bansal, Adam Mainella
A Metric-Driven Analysis of Defending the Golden State Warriors
Submitted to the 2023 Syracuse University Basketball Analytics Competition
6:30pm – 7:00pm
Hassaan Inayatali, Daniel Hocevar, Aaron White
Between the Lines: How Do We Measure Pressure in the NFL?
Finalist for the 2023 NFL Big Data Bowl ($10,000 prize money)
7:00pm – 7:15pm
Dinner
7:15pm – 7:40pm
David Awosoga, University of Waterloo
Beyond the Boxscore: Applications of Team and Individual Performance Evaluation Metrics in U SPORTS Basketball
Undergraduate thesis, University of Lethbridge
Slides
7:40pm – 8:00pm
Aaron White, Ethan Baron, (Daniel Hocevar, Kabir Malik)
RIPP: Holistic Player Evaluation with Region-Based Isolated Player Performance
Winner of the undergraduate category at the 2022 Big Data Cup ($1,000 prize money)
Slides
Hayden Groer, Bhanu Mamillapalli, Daniel Lim, Siddhi Bansal, and Adam Mainella entered the 2023 Syracuse University Basketball Analytics Competition. They were given just 1 week to craft a presentation on their analysis of the best way to defend the 2022 NBA Champion Golden State Warriors. They competed against other groups from American universities and were judged by high-level basketball analytics minds.
Wednesday, February 8th, 2023, 8pm EST
David Awosoga
Resources:
https://colab.research.google.com/drive/1ibgNYo_nKe0ABsrWZBYvyAXgoRuA8oOt?usp=sharing
Wednesday, February 1st, 2023, 8pm EST
Daniel Hocevar
Wednesday, January 25th, 2023, 8pm EST
Hassaan Inayatali
Resources:
https://colab.research.google.com/drive/1v3_FgHoGIPsMhuCoWAwCanKI6T9dgidv#scrollTo=tw9e0r6xCbZ-
Wednesday, January 18th, 2023, 8pm EST
Aaron White
Resources:
https://colab.research.google.com/drive/1a-K1h7u96D4tWBn4cAsmyJhDi_uddFK4#scrollTo=Mu8irflyT-4O
Wednesday, January 11th, 2023, 8pm EST
Ethan Baron
Resources:
https://docs.google.com/presentation/d/1cDyXG3LrNk8TpvqYCZplfog1VIkl2fQoyldLjhJR0Gk/edit#slide=id.g427dfcb35c_1_0
https://fivethirtyeight.com/features/how-our-2022-world-cup-predictions-work/
Wednesday, November 30th, 2022, 8pm EST
Ethan Baron
Resources:
https://colab.research.google.com/drive/1plJXSXOYpTYncIAU96ZSBM58mLSVJ6ts
Wednesday, November 16th, 2022, 8pm EST
Aaron White
Resources:
https://docs.google.com/presentation/d/1Wk381kQ7qx3foaKaLADNbcHbOY7WD9QzKDZMOHaIXW8/edit?usp=sharing
https://colab.research.google.com/drive/1zzE5e0HKmwnDA3meG5VdM4B2XZkZAbxa#scrollTo=HNevvyTSNqXW
Wednesday, November 2nd, 2022, 8pm EST
Daniel Hocevar
Resources:
https://colab.research.google.com/drive/1CWfrYRrY9a-uFC7A7ZofPwNLXpbg-Et_?usp=sharing
Wednesday, October 26th, 2022, 8pm EST
Hassaan Inayatali
Resources:
https://colab.research.google.com/drive/1CWfrYRrY9a-uFC7A7ZofPwNLXpbg-Et_?usp=sharing
Wednesday, October 19th, 2022, 8pm EST
Ethan Baron
Resources:
https://drive.google.com/file/d/1Fb6IfC4pNILZAzA1CpBONff_243g7QRw/view?usp=sharing
Wednesday, October 5th, 2022, 8pm EST
Aaron White
Resources
https://docs.google.com/presentation/d/1PR7EVyHo_J8DpEB5C18V6kTkoH7jPbq9RkHwLuirhF4/edit#slide=id.p
https://colab.research.google.com/drive/12or4XzV0st_0KW4ihdKfQvDxDWrGqdo0#scrollTo=9VihxaUJb5ey
Wednesday, September 28th, 2022, 8pm EST
Hassaan Inayatali
Resources
https://docs.google.com/presentation/d/1Pu2vIc2pseb6t1AL9wKKn0uxftcxhahWIMXV6gKySJ4/edit#slide=id.p
https://colab.research.google.com/drive/1CmpLm4Od8K-arzpwnEr8uADHhCxzxUjr?usp=sharing
Wednesday, September 21st, 2022, 8pm EST
Daniel Hocevar
Resources:
https://colab.research.google.com/drive/1qZfMGL_801JUlD1zHd_3ODOsuVZdOzwU?usp=sharing
Monday, September 14th, 2022, 8pm EST
Ethan Baron
Congratulations to team members Ethan Baron, Daniel Hocevar, Kabir Malik, and Aaron White for winning first place in the undergraduate category of the 2022 Big Data Cup, a hockey datathon hosted by Stathletes and CANSSI!
Their submission, titled “RIPP: Holistic Player Evaluation with Region-Based Isolated Player Performance,” presents a method to evaluate women’s hockey players using play-by-play data.
Check out their talk at https://www.youtube.com/watch?v=QcfcsO8A3k0.
Thursday, March 24th, 2022, 8pm EST
Daniel Hocevar
Resources:
Thursday, March 17th, 2022, 8pm EST
Ethan Baron
Resources:
Thursday, March 10th, 2022, 8pm EST
Colin Conant
Resources:
Thursday, March 3rd, 2022, 8pm EST
Ethan Baron
Resources:
Monday, Feburary 14th, 2022, 8pm EST
Hassaan Inayatali
Resources:
Monday, Feburary 7th, 2022, 8pm EST
Colin Colant
Monday, January 31st, 2022, 8pm EST
Ethan Baron
Resources:
Monday, January 24th, 2022, 8pm EST
Daniel Hocevar
Resources:
Monday, January 17th, 2022, 8pm EST
Colin Conant
Resources:
Monday, January 10th, 2022, 8pm EST
Hassaan Inayatali
Resources:
Wednesday, October 13th, 2021, 8pm EST
Ethan Baron
Monday, September 27th, 2021, 8pm EST
Daniel Hocevar
Resources:
Monday, September 20th, 2021, 8pm EST
Ethan Baron
Friday, December 4th, 2020, 6pm EST
Julien Guyon (Bloomberg, NYU, Columbia)
(1) Risk of Collusion: Will Groups of Three Ruin the FIFA World Cup?
(2) “Choose Your Opponent”, a New Tournament Design
Please find a recording of the presentation below.
In 2026, the FIFA World Cup will for the first time gather 48 men’s national teams. It will consist of a group stage made of 16 groups of three, with the best two teams in each group advancing to the knockout stage. Using groups of three raises several fairness issues, including risk of match fixing and schedule imbalance. In this article we examine the risk of collusion. The two teams who play the last game in the group know exactly what results will let them advance to the knockout stage. Suspicion of match fixing occurs when a result qualifies both of them at the expense of the third team of the group, and can seriously tarnish the tournament. We quantify how often this is expected to happen and explain how to build the match schedule so as to minimize the risk of collusion. We also quantify how the risk of collusion depends on competitive balance. Moreover, we show that forbidding draws during the group stage (a rule considered by FIFA) does not eliminate the risk of match fixing, and that surprisingly when draws are forbidden the 3-2-1-0 point system does not do a better job at decreasing the risk of collusion than the 3-0 point system. Finally we describe alternate formats for a 48 team World Cup that would eliminate or strongly decrease the risk of collusion. Then, we present a new knockout format for sports tournaments, that we call “choose your opponent”, where the teams that have performed best during a preliminary group stage can choose their opponents during the subsequent knockout stage.
Tuesday, November 24th, 2020, 11am EST
Ioannis Ntzoufras (Athens University of Economics and Business)
ntzoufras@aueb.gr
Bayesian Quest for Finding a Unified Model for Predicting Volleyball Games
See a recording of the presentation below.
Volleyball is a team sport with unique and specific characteristics. We introduce a new two level-hierarchical Bayesian model which accounts for these volleyball specific characteristics. In the first level, we model the set outcome with a simple logistic regression model. Conditionally on the winner of the set, in the second level, we use a truncated negative binomial distribution for the points earned by the loosing team. An additional Poisson distributed inflation component is introduced to model the extra points played in the case that the two teams have point difference less than two points. The number of points of the winner within each set is deterministically specified by the winner of the set and the points of the inflation component. The team specific abilities and the home effect are used as covariates on all layers of the model (set, point, and extra inflated points). The implementation of the proposed model on the Italian Superlega 2017/2018 data shows an exceptional reproducibility of the final league table and a satisfactory predictive ability.
Friday, November 20th, 2020, 6pm EST
Dan Forestall, Emily Hunter, Sara Stephens & Maia Gibbon (Queen’s Geometric Sport Analysis Group)
Geometrically Modeling Soccer and Basketball Games
To watch the presentation, see below.
With a focus on understanding the impact of player position, and how it evolves over time, we look at several 3-dimensional models of soccer & basketball games. This work builds off of that of Pleurer, Spearman, and others.
Monday, November 16th, 2020, 4pm EST
David Perdomo Meza (Twenty3 Sport)
Email: dperdomomeza@gmail.com
Twitter: @dperdomomeza1
Title: Tactical Insight through Stylistic Representation of Team Playing Style Using Latent Dirichlet Allocation
Check out the recording below:
We’ll showcase the application of Latent Dirichlet Allocation as a topic modelling technique on football statistics to obtain a mixture model representation of “team playing style” – and go through its application to evaluating tactical choices in team head to heads in the English Championship.
Monday, November 2nd, 2020
Jeremy Alexander (Victoria University)
The Impact of a Team Numerical Advantage on Match Play in Australian Rules Football
See a recording below.
The advent of player tracking technologies has supported a more detailed approach to the match analysis of invasion sports. Studies to date that have investigated tactical team behaviour by measuring how players occupy different sub-areas on a playing field in football have inferred performance by assessing a team’s capacity to generate a numerical advantage over a specific area. As such, a limited understanding exists between a team’s numerical advantage and the impact on match play in a continuous manner. Therefore, the primary aim of this study was to provide a proof of concept that determines the relationship between a team numerical advantage and match play in a continuous manner. The secondary aim was to determine how ball position and match phase influence how players occupy different sub-areas of play in Australian Rules Football.
Information
Our first tutorial took place on Friday, October 23rd at 7:00pm EST. If you missed it, check out the notebook we used at https://utoronto-my.sharepoint.com/:u:/g/personal/eth_baron_mail_utoronto_ca/EaRu6yXz9M1MuO5VBZ0ed6EBocTIFdpsiTgoDMmasYtqNA?e=73asnW.
Learn how to web scrape
Web Scraping is a valuable tool, especially for those that enjoy creating independent coding projects. It allows for more creative projects by giving the user the ability to obtain their own niche data. This tutorial will focus on the fundamentals of how to web scrape, with additional focus on how a webpage is broken down and how to clean your obtained data.
Friday, October 30th, 2020
Kenneth Brent Smale (Los Angeles Angels, Apex Skating)
Transitioning from Academia to Industry: Analytics in Pro Sports
Check out the recording below.
As a student, the bulk of your training in analytics comes in the classroom and is heavily involved in the theory and simple strong signal-to-noise examples. In reality, and particularly in sports, things get much noisier with true data and different personalities and stakeholders. Kenneth Smale will talk through just how analytics differs from academia to the industry and provide guidance on how to make the transition as easy as possible.
Wednesday, October 14th, 2020, 6:00pm EST
Dani Chu (Seattle Kraken)
It’s Fun Getting Into (Foul) Trouble
This project investigates the fouling time distribution of players in the National Basketball Association. A Bayesian analysis is presented based on the assumption that fouling times follow a Gamma distribution. Methods are developed that will allow coaches to better manage their players under the threat of fouling out.
See a recording of the presentation below.
Friday, October 9th, 2020, 6:00pm EST
Abdullah Zafar (Sports Performance Analytics Inc.)
Mathematical Modelling in Professional Sport
How to quantify actions in sport in order to build metrics, get insights, and drive performance? In this talk, we will overview, compare and contrast approaches using football (soccer) data from the Danish Superliga; focusing on how we can model the movement of a team using flow fields and dynamical systems, derive metrics to quantify team tempo, and then demonstrate the utility and application to the physical training of players as well as team performance as a whole. We will then break down tempo further using topological time series analysis to better understand the dynamics of a football match and highlight the difference in teams during goal-scoring moments.
For a recording of the presentation see below.
Written by: Doug Duffy
With the Blue Jays flying north and spring training squarely in the rear-view mirror, Torontonians can leave behind their masochistic winter ritual, watching the Maples Leafs, in favor of their spring ritual, asking “Is the dome open yet?”. Incidentally, in the year 2015, there’s a twitter account for that. Along with the arrival of Opening Day has come the annual barrage of previews, some more quantitative than others. My personal favorite was the series of previews published on Grantland for each of baseball’s divisions, nicely melding projection systems, depth charts and win projections with more qualitative subjects like strengths/weaknesses and storylines. I, however, chose to take the opportunity to dig into the Pitch f/x database for the first time to see what it can tell us about the 2015 Blue Jays hitters, especially the new arrivals. Hopefully, I’ll get around to performing something similar for the pitching side of things soon.
Read more 2015 Toronto Blue Jays’ Hitters: A PITCHf/x Preview
Written by: Doug Duffy
If you’ve ever participated in a fantasy draft of any kind, you’re familiar with the concept of projections. Projections, they’re (almost) as simple as they sound. What do you project a given player to accomplish based on his past accomplishments? Projections are not restricted to the realm of fantasy sports however; teams utilize projections as well, to assist them in player valuation. In this post I’ll explain how you can use projections for player valuation for your own fantasy baseball league, using a model based either on Standing Points Gained above replacement, or Fantasy Points above replacement, depending upon the scoring system of the league [1]. In addition, I’ll be posting the R code used to perform the models, as well as Draft Cheat Sheets containing relevant draft info from many of the sources we searched.
Special Request (AL-only 4×4 10 Team no R or K) : 4x4ALonly10Team
Update (3/21/2015) : The projection database and draftsheets have all been updated, and the R code used to calculate TOTspgAR and FPtsAR has been posted. Enjoy.
Read more Using Projection Models for 2015 Fantasy Baseball Drafts
Earlier today the UTSPAN team had the pleasure of attending the 2015 Sports Industry Conference hosted by the University of Toronto Sports and Business Association (UTSB). UTSB were kind enough to let us set up a small booth with a poster to show off a bit of our work and extend an invitation to all attendees. The conference was a big success and we would like to thank UTSB for hosting an extremely well-organized event with top class panels.
We would like to announce that our next meeting will be held on Monday 16 March 2015 at 7PM in room 3008 of the Bahen Centre for Information Technology (40 St George Street). Join us to learn more about the group and what we hope to achieve in the coming months! We will also be hoping to discuss some possibilities for the upcoming UTSPAN Data Hack-a-thon!
A big thank you to everyone who stopped by the booth to chat with us! If you have any questions feel free to reach out to us on Twitter or by email at: sportsanalytics@utoronto.ca
Written by: Valentin Stolbunov
Soccer, or football, or footy, or “the beautiful game” is the world’s most popular sport. When trying to prove this to a fan of North American sports, a soccer fan’s best weapon is usually global TV audience numbers. The 2014 Super Bowl had an audience of about 160 million viewers worldwide. The same year, the FIFA World Cup final had a global audience of about 1 billion. So, yeah, soccer is popular.
The recent sports analytics movement, however, didn’t originate from the world’s most popular sport. Most would agree it started with baseball and then spread to other North American sports – hockey, basketball, and football (the one with helmets). Compared to these sports, the use of advanced or “fancy” stats in soccer is still in the early stages.
Written by: Kurtis Judd
Whether you’re simply interested in following home run races, or using programming languages to predict next year’s MVP, it’s hard to argue that baseball isn’t a statistics driven sport. Every event in the game is so discrete, that it’s a statistician’s dream of clean, easy to work with data.
We have set up a free forum for UTSPAN on ProBoards! A link has also been added to the menu bar in the top right of our webpage.
This will serve as our primary project work platform as it allows us to share ideas, images, code, links, and just about anything else. The forum will be visible publicly and there are no restrictions on membership. Sign up and get started!
Keith Lyons, Adjust Professor of Sport Studies at the University of Canberra, recently reached out to share his new open course on Sport Informatics and Analytics!
The course starts on 23 February 2015. You can have a look at the course description here:
https://www.canvas.net/browse/ucanberra/courses/sport-informatics-and-analytics
We will be holding our third meeting on Monday 9 February 2015 at 7PM in BA3008.
Apart from a couple of announcements, this will largely be a round table for everyone to discuss any ideas moving forward.
As ever, new members are always welcome!
We will be holding our second meeting on Monday 26 January 2015 at 7PM in BA2135.
This meeting will have a number of short presentations from the smaller project exploration teams. We aim to decide on the focus of the handful of projects which will ultimately be our work for the next couple of months.
New members are always welcome! Come out and see what UTSPAN is planning to do!
We will be holding a general information meeting for anyone interested in joining the group or just hearing more about what we plan to do!
The meeting will likely cover:
This meeting will be followed by a more technical meeting in the coming weeks.
Written by: Valentin Stolbunov
Our mission statement
At the University of Toronto Sports Analytics Group, we aim to connect members who share an interest in the field. We also aim to support the analytics process and help members explore their own interests. Members can work together to find and manage data, to develop and test analytic models, and to present and publish their findings. Last but not least, we hope to connect members with industry professionals.
Our methodology
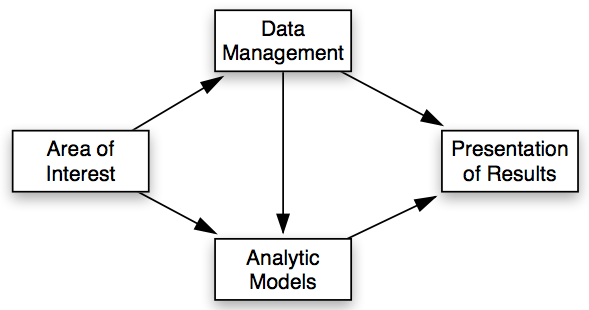
It is clear from our earlier introduction to sports analytics that Alamar’s structure of the sports analytics process is about feeding the decision makers. This is an indication of the place sports analytics has in a sports organization. However, because we do not operate within any particular organization, the structure needs to be revised slightly.
We do not have decision makers to whom we would provide our findings. Instead, our work is motivated by a question or a general area of interest. In many ways, this is similar to a coach asking the analytics team a question along the lines of “who is the best player we can sign for around $3 million?”. So instead of using a methodology that is designed to feed into a larger framework, we have altered the structure to instead begin with an element of motivation.
With no decision makers to facilitate, the information systems are no longer used to support the final element in the process. As the final element themselves, these systems must now focus on presenting the findings of the data and/or models in the same effective and efficient manner. Hence their new name: Presentation of Results. This presentation may be verbal (an essay-style argument that Player A is a better “scorer” than Player B), or visual (a visualization which shows the two players’ scoring habits), or both.
Our methodology will follow the sports analytics process above. A more specific, question-based, step-by-step process would look something like this,
A basic example
Let us assume we were looking to determine who is currently the most dominant scorer in the NBA. This problem is ultimately as complicated as you would like to make it, but for the purposes of this demonstration we will keep it simple. The answers to our questions above would look something like this,

A more advanced example
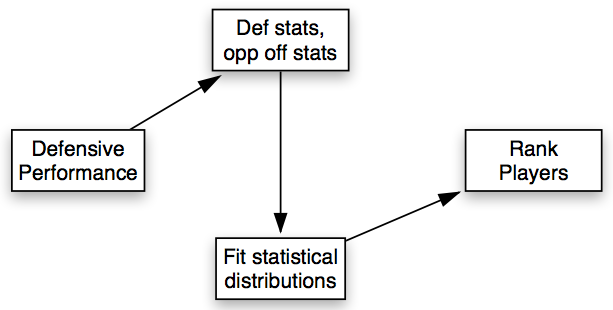
A more difficult problem would be determining the best “lock down defender” in the NBA. Some sort of model would probably be necessary this time and the answers would look something like this,
Written by: Valentin Stolbunov
Defining: Analytics
Before jumping to Google and adding “wiki” to the end of my search query, I thought I’d try to define analytics myself. When I think of analytics, I usually think of finding patterns in data and using those patterns to answer questions. Wikipedia says I am not too far off:
Analytics is the discovery and communication of meaningful patterns in data.
The important thing to note at this point is that analytics is a process. In fact, it is an interdisciplinary process which usually brings together mathematics, statistics, computer science, predictive methods, data visualization, and other fields of study.
It is also important to note that analytics relies on the presence of data. This ultimately differentiates the term from “analysis” and unfortunately creates confusion when trying to decide if what you are doing is analytics or “data analysis”. For our intents and purposes, the two are essentially the same process. However, the field has been dubbed “sports analytics” and not “sports data analysis”, so we will accept the name and move on.
Before continuing to the sports side of things, it should be noted that the term “analytics” may also be used to describe the results of this process. For example, “the analytics of our last project suggest that…” is a perfectly valid sentence. However, in my experience I find that here it is best to just replace “analytics” with “analytical findings” or “results” and reserve the term “analytics” for the process through which these results are obtained.
Defining: Sports Analytics
This is where Wikipedia does not offer much help – nor does it need to. Sports analytics is essentially the analytics process, as described above, applied to sports.
It is the process of using sports-related data (anything from player statistics to game day weather) to find meaningful patterns (strong correlations, hidden trends, etc.) and communicate those patterns (using graphs, charts, essays, etc.) to help make decisions.
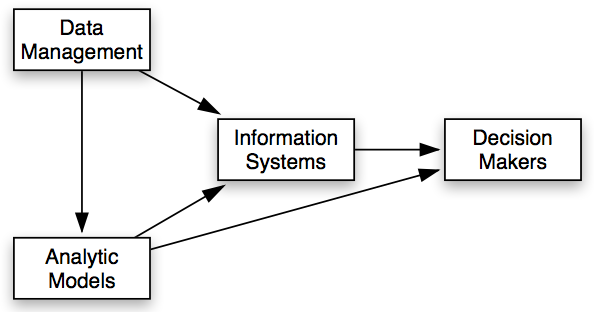
In his book, Benjamin Alamar presents a helpful graphic to illustrate the overall sports analytics process. In his framework, sports analytics consists of four elements: data management, analytic models, information systems, and the decision maker.
I have done my best to provide both Alamar’s definition of each element and my own thoughts on their uses and values:
What is the history of the field?
Although many professionals believe that modern model-heavy sports analytics is at a point of exciting growth, the field of sports analytics is by no means new. Technically speaking, any time anyone has ever used data to make a decision related to sport, they were conducting analytics. However, the general consensus is that sports analytics began sometime in the 19th century with baseball. The data (basic statistics such as hits and pitches) was collected with good old pencil and paper. It was then used create scouting reports which a coach or manager would use to make decisions about their team.
Referring back to Alamar’s graphic of the entire process, this type of analytics would lack a modelling element but still follow a logical flow toward the decision maker. These 19th century baseball decisions to be made were perhaps fewer and less detailed, but not necessarily easier.

What is the current state of the field?
We now have two things which we didn’t have in the 19th century of baseball analytics. The first of these is more sports nerds. Sports have grown in popularity and fans have become much more demanding of information. More often than not sports arguments include statistics, even if they are about whether or not “number of rings” is a statistic. Everyone and their parents have a fantasy team and compulsively refresh Twitter in hopes of finding out how long Derrick Rose will be out for this season.
The second thing we now have, which in some ways overlaps with the first, is more data. The recent advances in technology have affected just about every aspect of life, and sports is no different. The following things have all contributed to the recent growth in the field:
Modern sports analytics uses database management systems and things like SQL where pen and paper were once the norm. Analytical models from machine learning and data mining are now used to help sort through the data and find patterns. Models are now updated in real time and together with innovative visualization techniques are the new breed of information system.
With more data, and more people interested in sports analytics, organizations are doing their best to gain every possible advantage in every aspect of sports from training routines to player recruitment and valuation.
What does the future hold?
The field is growing.
More and more sports organizations are hiring analytics “teams” and “departments”, usually composed of professionals with STEM (science, technology, engineering, mathematics) degrees. The media appears to be following suit by recruiting data science professionals to find and visualize the unique trends that their viewers want to see. There is no reason to believe that these new opportunities will stop popping up or disappear all together.
In addition, social media has helped connect fans and form communities of the analytically-inclined. Whether out of personal interest or in hopes of being noticed, more fans will create stats-based blogs and continue to explore the numbers of their sport.
The field has also not gone unnoticed in academia. If conferences like MIT’s Sloan, journals like Quantitative Analysis in Sports, and new courses offered by top universities are any indication, institutions have noticed the growth in sports data and are interested in conducting research in the field.
Sports analytics is sometimes discounted as just an invention of weird metrics. But it is much more than that. From engineering solutions in data, like SportsVu, to innovative information systems, like shot charts, the future of the field is in ultimately working to advance each step of the whole process.
We are a group of passionate sport fans who are interested in building predictive and analytic mathematical models for everything from ping pong to hockey. We will be having meetings at the U of T St. George campus. Stay tuned for more information!