Written by: Doug Duffy
With the Blue Jays flying north and spring training squarely in the rear-view mirror, Torontonians can leave behind their masochistic winter ritual, watching the Maples Leafs, in favor of their spring ritual, asking “Is the dome open yet?”. Incidentally, in the year 2015, there’s a twitter account for that. Along with the arrival of Opening Day has come the annual barrage of previews, some more quantitative than others. My personal favorite was the series of previews published on Grantland for each of baseball’s divisions, nicely melding projection systems, depth charts and win projections with more qualitative subjects like strengths/weaknesses and storylines. I, however, chose to take the opportunity to dig into the Pitch f/x database for the first time to see what it can tell us about the 2015 Blue Jays hitters, especially the new arrivals. Hopefully, I’ll get around to performing something similar for the pitching side of things soon.
For those unfamiliar, the Pitch f/x database is the system than underlies the pretty MLB.com Gameday interface. In addition to the pitch type, location and velocity it records information for a number of other variables. In the analysis here I’ll examine data relating to at bat result, batted ball location (x,y positions) and batted ball type (linedrive, fly ball, etc.). For a fuller appreciation of the data available take a cruise around Baseball Savant, which is where I pulled data from before performing analysis in R.
I examined this data for each Blue Jay hitter projected by FanGraphs to have more than 100 PA this coming year. Spray charts are plotted by at bat result using the most recent data of approximately one years worth of batted balls (~300-500), though for some young players obviously this was not possible. Though the spray charts are laid over Rogers Center field dimensions, data from all games, and thus other stadiums, are plotted. The sample sizes and years used are displayed in each plot’s title, take note that spring training data was used for both Dalton Pompey and Devon Travis to increase the sample size. Tables of batted ball profiles (line drive %, fly ball %, in-field fly ball %, etc.) for each hitter by year are also shown, again with sample sizes noted and spring training data used for Pompey and Travis. The results are presented in what should largely resemble the Opening Day lineup, though the exact usage of Encarnacion, Navarro and Smoak in the DH slot will likely vary day to day. The R code used to plot the spray charts and compile the batted ball tables can be found here and here, respectively.
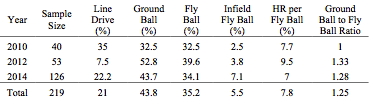
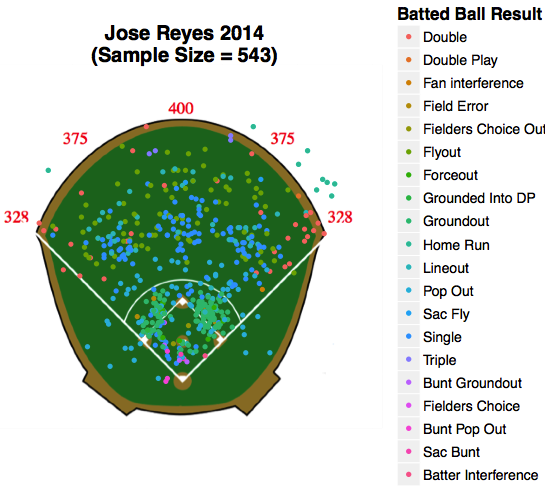
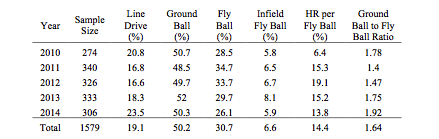
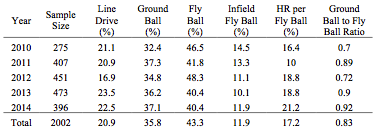
1. Jose Reyes – SS; Bats: Switch; Zips Proj.: 609 PA, 0.285/0.333/0.412, 2.9 WAR
Reyes’ ability to get on base (when healthy…) should go a long way to providing RBI opportunities for the stacked top of the Blue Jays’ lineup. A switch hitter, Reyes possesses a bit more power hitting left handed with 8 HRs against 1 HR hitting right handed in 2014 in 473 and 181 PA, respectively. It is also interesting to note that all four triples he hit were to fairly straight-away center, as opposed to gap shots and corner-rattlers.
Reyes keeps the ball out of the air, hitting nearly 25% more ground balls than fly balls in each year from 2010 to 2014 (like Wesley Snipes at 1:15, keeping down his pushup count). The batted ball profile is fairly stable from 2010 to 2013, but in 2014 Reyes’ turned it up a notch by hitting 4% more line drives than any other year.
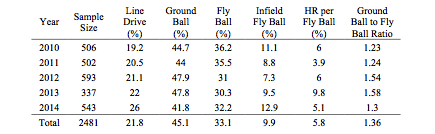
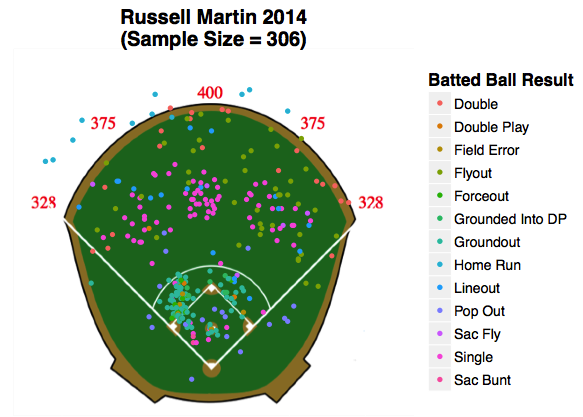
2. Russell Martin – C; Bats: Right; Zips Proj.: 453 PA, 0.237/0.337/0.407, 3.7 WAR
The Blue Jays’ much discussed new catcher, whose pitch framing ability is now notorious, should also be a significant upgrade as a hitter. Martin possesses power to nearly all fields, but from the spray chart one thing is apparent, a curious lack of flyouts. This becomes even clearer examining his batted ball profile, he hits ground balls a remarkable 50% of the time, especially for someone who hits 15% of his fly balls beyond the outfield wall and who does not have the speed of the aforementioned Reyes.
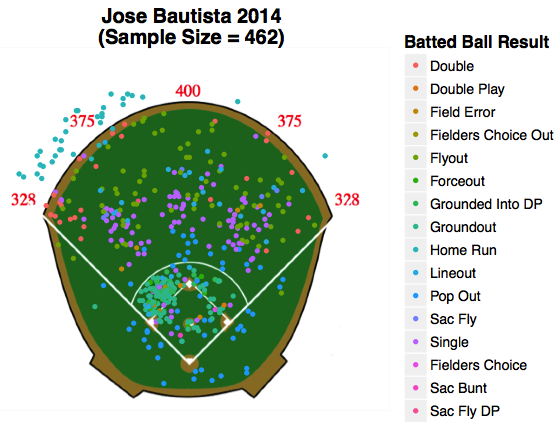
3. Jose Bautista – RF; Bats: Right; Zips Proj.: 524 PA, 0.267/0.384/0.515, 4.6 WAR
If you watch the Blue Jays at all, you don’t need me to tell you Bautista hits home runs to left field. Despite a couple opposite field home runs, the remainder of his 35 HRs in 2014 are closely clustered from left to left-center. An impressive 20% of his fly balls are home runs, though his fly ball percentage has dropped while his ground ball percentage has been creeping upwards from 2010 to 2014. This may be related to the general downward trend of both the strikezone being called and pitches thrown.
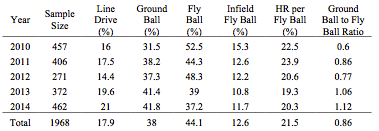
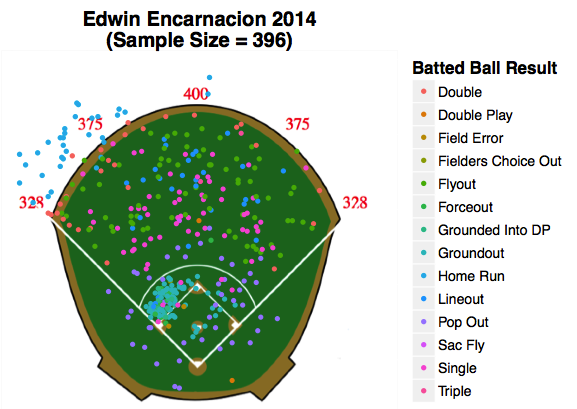
4. Edwin Encarnacion – 1B/DH; Bats: Right; Zips Proj.: 559 PA, 0.270/0.358/0.514, 3.4 WAR
Like his bash-brother, Edwin raises his chicken wing after smashing the ball towards left field, with occasional power to center and right. Edwin hits a slightly lower fraction of his fly balls for HRs than Joey Bats, 17% and 21% respectively. He has consistently hit a fifth of his batted balls for line drives, while resisting the trend towards more ground balls and less fly balls more successfully than Bautista.
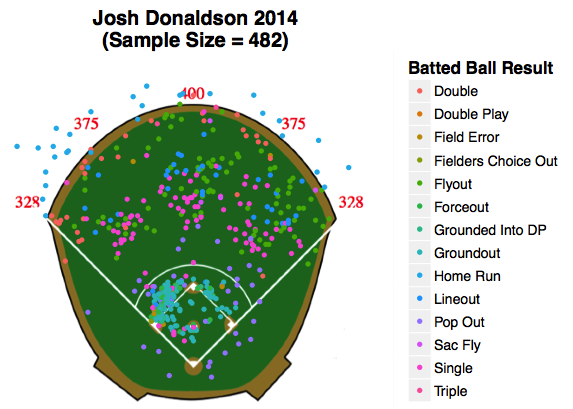
5. Josh Donaldson – 3B; Bats: Right; Zips Proj.: 624 PA, 0.265/0.338/0.468, 5.4 WAR
When I said earlier that Russell Martin had power to all fields, what I really meant was that Josh Donaldson has power to ALL fields. He had an relatively even HR distribution in 2014 from left field to right field, hitting 9 of his 29 HR to the right of dead-center, though this is somewhat less pronounced in his career data. As previously noted, it will be interesting to see how Donaldson’s hitting tendencies transfer to hitter-friendly Rogers Center.
Donaldson hits more ground balls, 45%, than either Bautista or Encarnacion, though not quite like the other new acquisition, Martin. He has also not matched the HR/FB rate of the other sluggers, 16%, just besting Martin, who sits at 14%.
6. Dioner Navarro – C/DH; Bats: Switch; Zips Proj.: 380 PA, 0.266/0.314/0.395, 1.7 WAR
Dioner, a switch hitter, displays equal power from both sides of the plate when accounting for how many more PA he takes hitting lefty versus righty, 378 and 142 PA in 2014, respectively. Incredibly, Navarro has hit more than a quarter of his batted balls for line drives in every year since 2012. To put this in perspective, of the five hitters above only Jose Reyes accomplished a 25% line drive rate, and he only did it once, in 2014. In 2013, Navarro somehow managed to hit a fifth of his fly balls for HRs, despite only a 10% clip for the period 2010-2014.

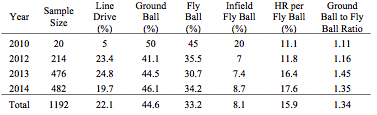
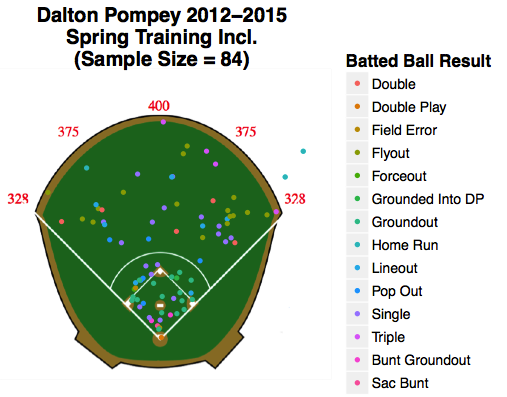
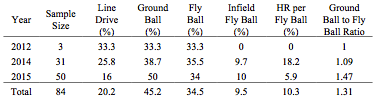
7. Dalton Pompey – CF; Bats: Switch; Zips Proj.: 561 PA, 0.239/0.298/0.348, 1.5 WAR
After spending 3 years at A-ball or lower 2010 through 2013, something clicked for Pompey in 2014 and he rocketed through the Jays’ farm system, amassing more than 100 PA at only two of the five stops. This success resulted in a September call-up, and his addition to the 2015 lineup makes for an intriguing hometown hero storyline to follow. This storyline creates a problem for our Pitch f/x analysis, there’s not much data. Pitch f/x systems are only installed for MLB games, and the spring training data is less complete (no pitch trajectory info). I’ve grabbed all the Pompey data available, 84 batted balls on 285 total pitches, which includes data from 2012 to 2015, though the majority of the data is from either 2015 spring training, ~110 pitches, or his 2014 MLB stint, ~150 pitches.
In the limited data set it appears that Pompey has the ability to hit the ball to all corners of the field, with some pull power as a lefty. His speed is evidenced by the fact that near 5% (4 of 84) of the batted balls here went for triples, and that none of his 5 doubles ever reached the wall. He managed to hit a quarter of his batted balls for line drives during his 2014 MLB stint, but if you need proof that it’s a small dataset look no further than his 18% HR/FB rate, similar to those of Encarnacion and Bautista. It will be interesting to see how this progresses moving forward.
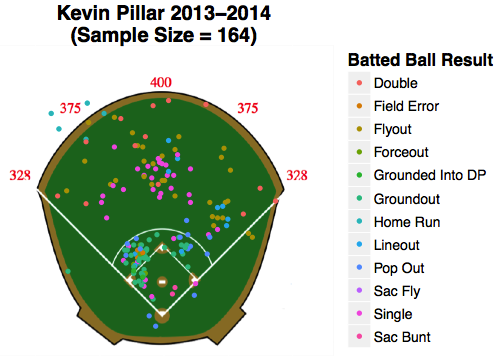
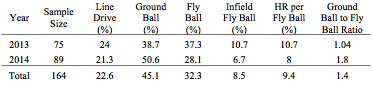
8. Kevin Pillar – LF; Bats: Right; Zips Proj.: 609 PA, 0.266/0.297/0.398, 0.8 WAR
Pillar will start the season as the left fielder, until Michael Saunders recovers from his incident with a certain sprinkler system, though thankfully he should be back during April. Like Pompey, Pillar has a limited amount of data available, 164 batted balls, spread over his MLB playing time in 2013 and 2014. Pillar has a touch of pull power, but clearly lacks power to the opposite field. His spray chart is curiously bare in left and right field, with an interesting concentration of batted balls to straight-away center. Maintaining a 20% line drive rate, while decreasing his ground ball percentage below 50% should allow Pillar to further improve his slash line.
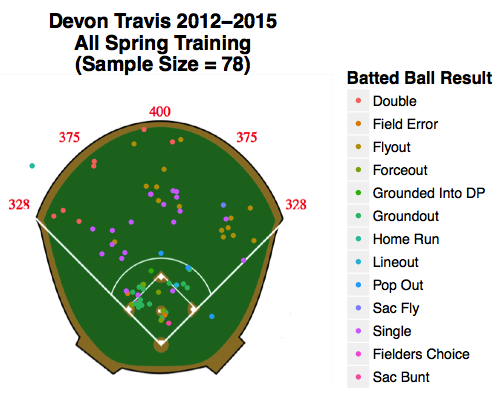
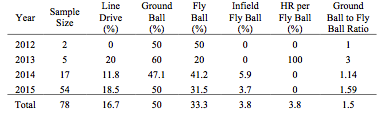
9. Devon Travis – 2B; Bats: Right; Zips Proj.: 505 PA, 0.244/0.290/0.381, 1.1 WAR
Rounding out the bottom part of the order with another young position player, Devon Travis can hopefully fill what I’ve considered a serious vacancy at 2B since I moved to Toronto in 2010. A prospect acquired from the Tigers in the Anthony Gose trade, Travis has never appeared in the majors and thus only spring training data is available for him, and it’s limited to only 78 batted balls on 144 pitches.
In this limited data Travis has excelled on balls pulled into left field, with 5 doubles and 7 singles against a solitary flyout, with his one HR was also pulled to left field. The same can’t be said of his success hitting to the opposite field where his 2 singles are weighted against 7 flyouts and a sacrifice fly. He almost maintained a 20% line drive rate this spring, but it came along with a 50% ground ball rate.
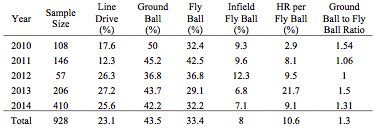
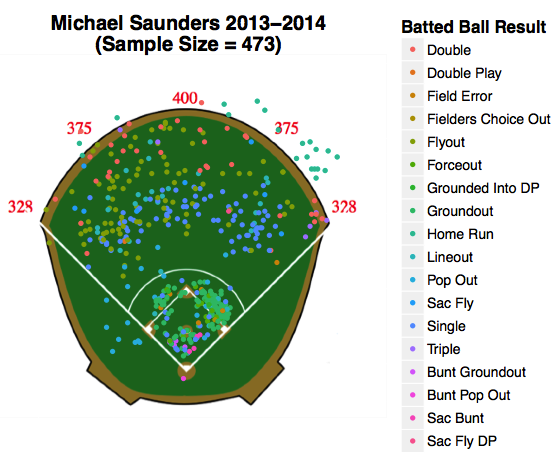
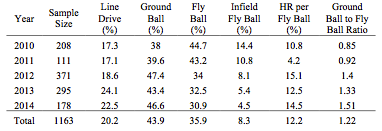
10. Michael Saunders – LF; Bats: Left; Zips Proj.: 442 PA, 0.246/0.320/0.425, 2.4 WAR
Saunders was having a solid first half in 2014, before an oblique injury suffered in July limited him to only 263 PA, and thus only 178 batted balls. Therefore I’ve plotted his spray chart of data from both 2013 and 2014, bringing the sample size up to 473, roughly in line with a full season of work. Saunders has decent pull power, and mixes in a touch of opposite field power as well, 3 of the 20 HR in the period 2013-2014. He has maintained a 20% line drive rate each of the last two seasons, but his fly ball percentage has dropped steadily from 2010 on.
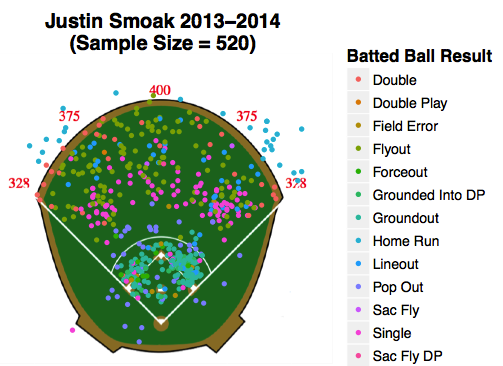
11. Justin Smoak – 1B/DH; Bats: Switch; Zips Proj.: 525 PA, 0.240/0.316/0.408, 0.5 WAR
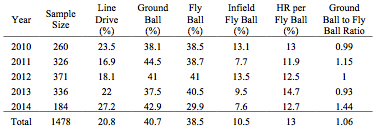
Smoak like his former Mariner-teammate Saunders saw only partial time in 2014, 276 PA, and thus the spray chart shown here takes data from both 2013 and 2014, for 520 batted balls. Smoak, a switch hitter, has more power hitting lefty, 23 of the 27 HR shown, including some power to the opposite field. The move out of pitcher friendly Safeco in favor of the hitter friendly confines of Rogers Center should push some of those long doubles over the wall as HRs. In the half season of time he put in in 2014, he maintained a stellar 27% line drive rate, but only a 30% fly ball rate.
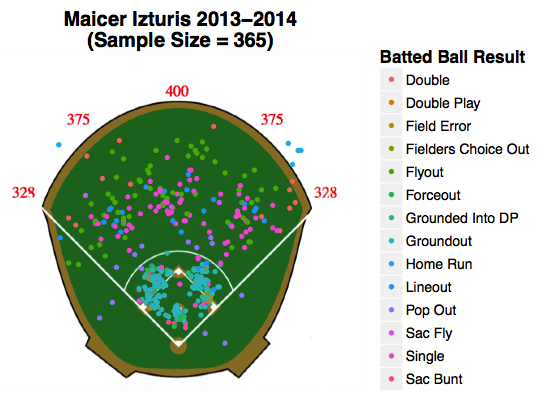
12. Maicer Izturis – 2B; Bats: Switch; Zips Proj.: 232 PA, 0.254/0.304/0.343, 0.2 WAR
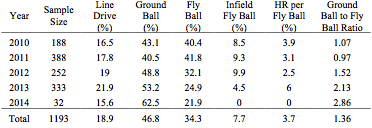
Maicer Izturis will start the season on the DL with a groin issue, and what becomes of the 2B position then remains murky, one thing is clear, he should see more time than last year, when his season ended before it really began. Izturis doesn’t display power often, but every so often he pushes one over the outfield wall, particularly while hitting lefty. The ballooning ground ball rate is somewhat concerning, but he still maintained a 20% line drive rate in his last full season, 2013.
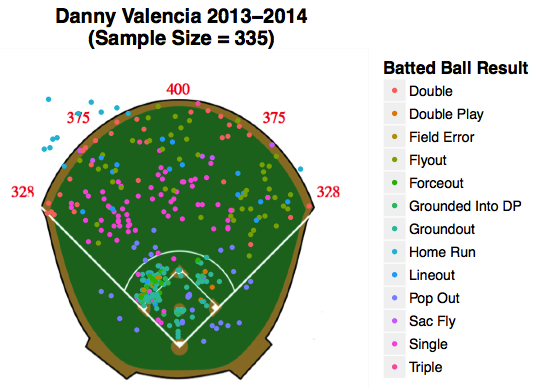
13. Danny Valencia – 1B/3B/DH; Bats: Right; Zips Proj.: 427 PA, 0.249/0.283/0.410, 0.9 WAR
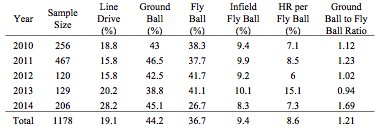
Valencia, acquired from the Royals last year, has the ability to drive the ball all over the field, but is markedly more successful pulling to left field than going to the opposite field. On balls batted to right field he has 5 singles, 3 doubles and 1 HR to go with 24 flyouts and 4 lineouts. His batted ball profile has been relatively steady over his career, but he managed to spike his line drive rate all the way up to 28% from a previous high of 20%.
14. Steve Tolleson – 2B; Bats: Right; Zips Proj.: 361 PA, 0.231/0.291/0.332, 0.5 WAR
Tolleson saw his most extensive major league action last season, at just 189 PA in his age 31 season. He, like Valencia, has a flyout to the opposite field problem, but appears to have sacrifice bunting down. Tolleson did manage to hit 22% of his batted balls for line drives, while maintaining a reasonable ground ball rate of 43%.