Written by: Doug Duffy
If you’ve ever participated in a fantasy draft of any kind, you’re familiar with the concept of projections. Projections, they’re (almost) as simple as they sound. What do you project a given player to accomplish based on his past accomplishments? Projections are not restricted to the realm of fantasy sports however; teams utilize projections as well, to assist them in player valuation. In this post I’ll explain how you can use projections for player valuation for your own fantasy baseball league, using a model based either on Standing Points Gained above replacement, or Fantasy Points above replacement, depending upon the scoring system of the league [1]. In addition, I’ll be posting the R code used to perform the models, as well as Draft Cheat Sheets containing relevant draft info from many of the sources we searched.
Special Request (AL-only 4×4 10 Team no R or K) : 4x4ALonly10Team
Update (3/21/2015) : The projection database and draftsheets have all been updated, and the R code used to calculate TOTspgAR and FPtsAR has been posted. Enjoy.
I’ve compiled a database of as many publicly available projection systems as I could find (ESPN, Yahoo, CBS, Steamer, Razzball, Zips, Clay Davenport’s and TG), and used this database to produce my own projection system, which I’ll refer to as the Duffy model (You’re right, I suck at naming things) [2-9]. I will have a later piece outlining how the various projection systems go about their business (tentatively titled: “99 Projections, But a Glitch in Each One?”), for now though, I’ll say the Duffy model takes the average of all the model’s (except TG as noted below) rate statistics (H-rate, BB-rate, etc.) for each player and projects them over the average number of plate appearances, or innings pitched for pitchers, predicted by the models [10]. In addition, as the Zips model makes no attempt to project playing time in the major leagues, we modified it by applying its rate based statistics over the average projected playing time from the other models, except the TG model for reasons explained below [11].
The Yahoo dataset used here is significantly smaller than the other datasets (approximately 300 players vs 900 players). The players it projects for are the top players, i.e. the ones receiving the most plate appearances, thus accounting for its skewed distribution shown below. This is an observer bias caused by my refusal to manually scrape projections for 1000 hitters and pitchers, though the supremely thorough among you might call this laziness (If you know how to programmatically scrape off Yahoo fantasy sports please let me know. I’m pretty sure I’m just running into the Great Pay Wall of RotoWire). On another note, the TG model has a curiously flat density function while every other model is clearly bimodal, so I’m somewhat skeptical of it. For instance, TG projects Kolten Wong to have a mere 303 PA, while each other model has him projected for over 500 PA [12]. The Duffy model closely matches the other relatively large datasets, Steamer and ModZips, in terms of projected plate appearances, as well as the other projected statistics. The Duffy model projections that will be used here to generate Fantasy Baseball values are also attached in raw form. The projected plate appearance distribution density functions for each model are plotted below in Figure 1, where the Duffy model is shown with increased line width (if you know how to display this increased line width in the legend using the ggplot2 R package, please let me know!).
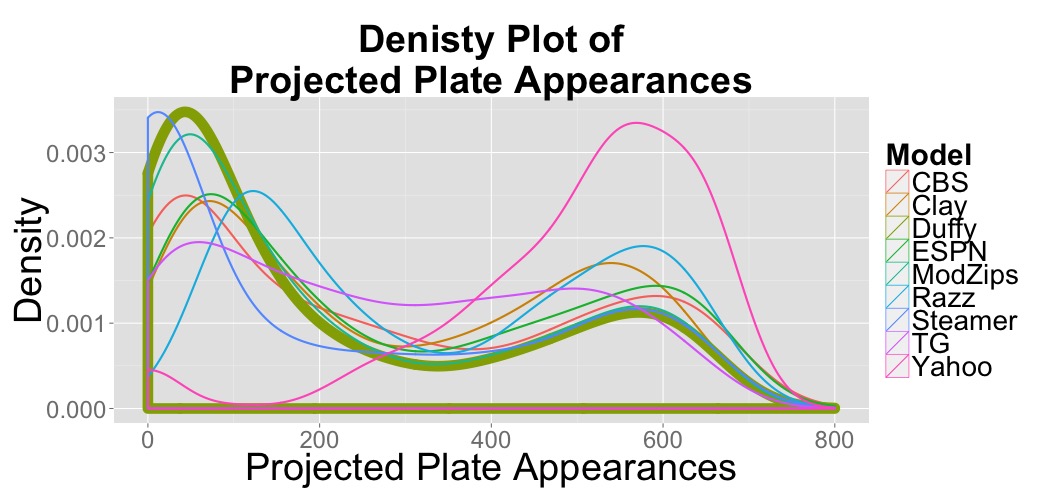
Figure 1: Projected PA Population Density by Model
Standing Points Gained – Theory
One of the most common fantasy baseball formats is known as rotisserie, where each team is scored in a number of hitting and pitching categories, often 5 each [13]. The team that scores the highest (or lowest for ERA and WHIP) in each category receives the maximum Standing Points, which is equivalent to the number of teams in the league, while the team that scores the least in each category scores 1 Standing Point. Each team is then ranked based on the sum total of its Standing Points from each stat category. The question in player valuation then becomes, how valuable is a HR vs a SB? A SV vs a W? Or even ERA vs a W?
In order to evaluate the comparative worth of one statistic versus another, we must see how each stat correlates with Standings Points, or mathematically speaking, determine the slope of the function Team Stat vs Standings Points Earned. As it was easiest to find data for previous league standings from my own fantasy league, which goes by the acronym VSNIC, such a plot is shown below for that league’s run scoring history in Figure 2. It is interesting to note what appears to be a decrease in the scoring environment from 2011 to 2014 (in 2009 and 2010 the league was fewer than 10 teams), perhaps further evidence that it’s a good time to be a pitcher.
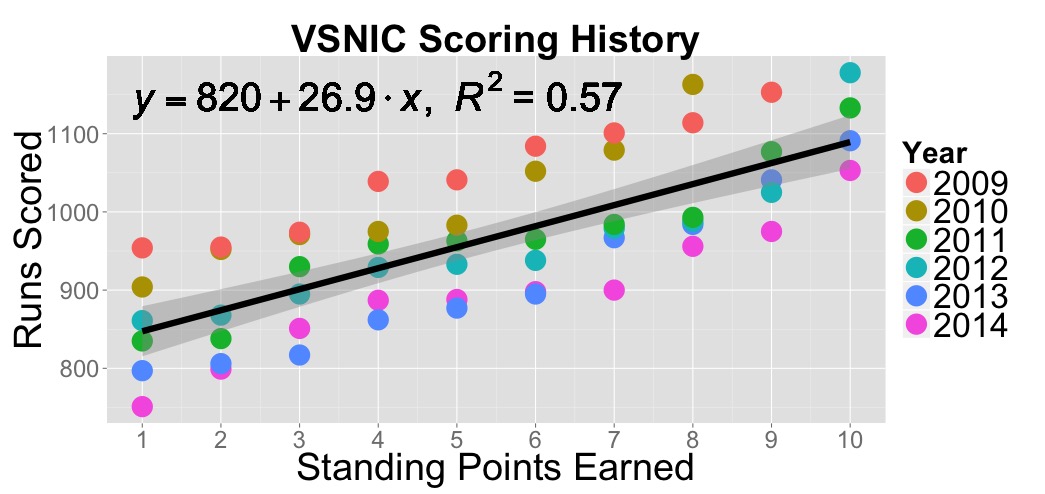
Figure 2: VSNIC Runs vs Standing Points Earned
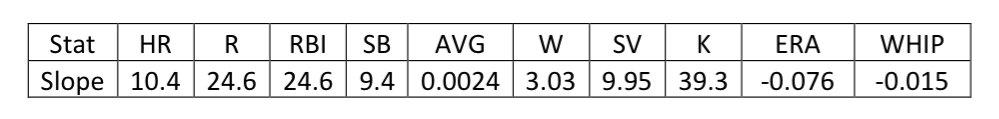
Similar functions can be described for each of the other statistics (R, HR, RBI, SB, AVG, W, SV, K, ERA, WHIP in standard 5×5 scoring). For the SPG model on the attached draft sheets, the slope values were taken from Razzball, and are shown below in Table 1 [14]. (Note: If performing this modeling yourself, it is always best to use your own league’s scoring history, if possible.)
Table 1: Razzball Standing Point Gained Slopes
Standing Points Gained – Calculation
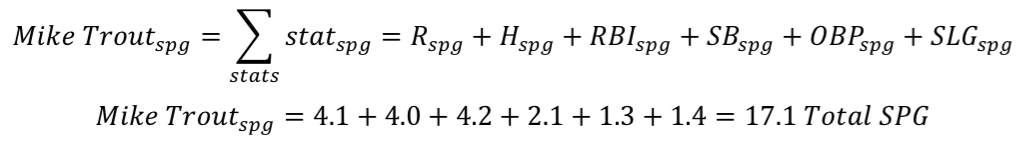
Using the slope of the simple linear model shown above, it can be seen that on average an additional 26.9 runs scored will result in one standings point gained (in VSNIC’s format). Then a player such as Mike Trout, who we project to score 110 runs in the season, will be worth 4.1 standings points, in runs alone. The same calculation, shown below, can be performed for each of a player’s counting statistics to determine the standings points gained for each counting statistic category.
![]()
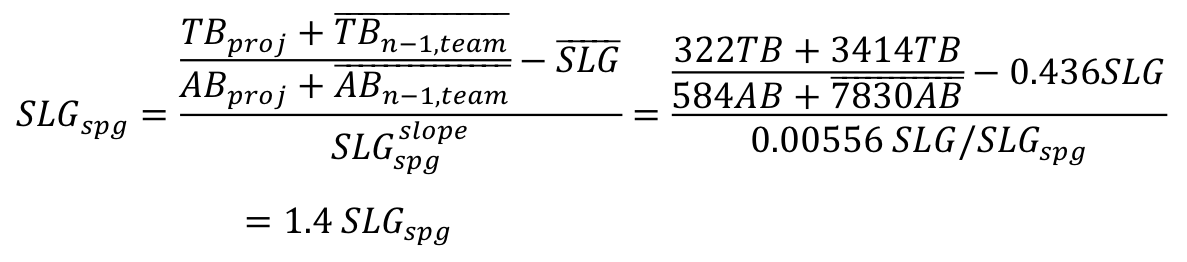
The calculation for rate statistics such as AVG and ERA, is slightly more complicated however, as each player’s contribution to the team’s rate is weighted by both his and his team’s number of attempts, either AB or IP. In order to determine a given player’s SPG for a rate statistic we must determine how the addition of his stats to the stats of an average team composed of one too few players (or mathematically speaking, n-1) compares to the fantasy league average rate statistic. This concept is perhaps demonstrated best in the equations shown below for slugging percentage standings points gained, again taking Mike Trout and the settings from 10-team VSNIC as our example (VSNIC uses OBP and SLG, not AVG or HR), where bars over variables indicate the average of the given variable. Mike Trout’s projected 322 TB in 584 AB would shift a team composed of n-1 average players, from the league average SLG of 0.436 to a SLG of 0.444, meaning he is responsible for approximately 1.4 standings points gained for SLG.
By summing over the standings points gained for each statistical category we can obtain a single metric of total standings points gained for each player. This is again illustrated below using Mike Trout as the example player, with VSNIC scoring.
Throughout this discussion we’ve used offensive statistics as the examples, however similar computations are possible for each pitching statistic by again properly distinguishing between counting and rate statistics.
Replacement Level – Theory
At this point we’ve created a single metric by which to value every player in MLB whom we have predicted stats for. This is a powerful tool, but not a tool by which you should draft your lineup, as this metric neglects to account for some things, notably position scarcity. Every position’s hitters were not created equal; it is much easier to find a “good” hitter at 1B or OF, as these are positions where teams can hide good hitters who struggle defensively. Accounting for this position scarcity requires us to determine replacement level for each position, in a way that is similar to Wins Above Replacement, or WAR. Think of replacement level as “that guy” you can pick up on the waiver wire the day after the draft, Matthew Berry once termed this “The Wandy Line” [15].
In fantasy baseball, the first player at the position who won’t get drafted, based upon the number of teams and the roster settings of the fantasy league, defines replacement level for each position. This can be slightly confusing to wrap your head around, so we’ll illustrate using standard 10-team ESPN roster settings (1x C, 1x 1B, 1x 2B, 1x 3B, 1x SS, 1x 2B/SS, 1x 1B/3B, 5x OF, 1x Util, 9x P, 3x Bench). With 10 teams each needing exactly one C the result is simple, replacement level is the 11th C as ranked by Total Standings Points Gained. For 2B and SS however, each team requires 1x 2B, 1x SS and 1x 2B/SS, therefore, assuming an even split of the additional mixed roster spot between 2B and SS, replacement level is the 16th 2B or SS.
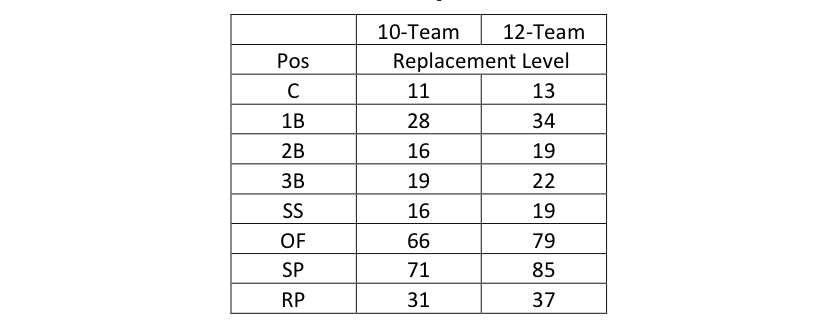
Before we define replacement level for 1B, 3B, or OF we must determine how to distribute the bench slots between hitters and pitchers. For this analysis we determined replacement level by allotting 2 bench slots to hitters and 1 bench slot to pitchers, leaving us with 1x Util and 2x BN slots to distribute to 1B, 3B, and OF. Our model allots 1.5 of these 3 slots to OF, 0.3 to 3B and 1.2 to 1B (I’ll explain how I got these values in a bit). This gives us (5 + 1.5) * 10 = 65 OF drafted, or 66th OF as replacement level. Splitting the corner infield spot evenly among 1B and 3B, gives us (1 + 0.5 + 0.3) * 10 = 18 3B, or 19th 3B as replacement level, and finally (1 + 0.5 + 1.2) * 10 = 27 1B, or 28th 1B as replacement level. The levels of replacement that were used to compile the attached draftsheets are summarized in Table 2 below.
Table 2: Position Replacement Level
These replacement levels are by no means intended as definitive, as the distribution of utility, mixed position and bench spots is left to the modeler’s discretion. The rankings produced using these levels gave me the “looks right” vibe, however tuning these levels is an iterative process.
The quantitative approach that was used in this iteration was to examine the replacement level statistics for each position as shown in Table 3 in the next section. Notice how we’ve tuned replacement level total standing points gained for each position, other than C and SS (which are exceptions in hitting ability due to the large defensive requirements), to be approximately the same level.
Standing Points Gained Above Replacement – Calculation
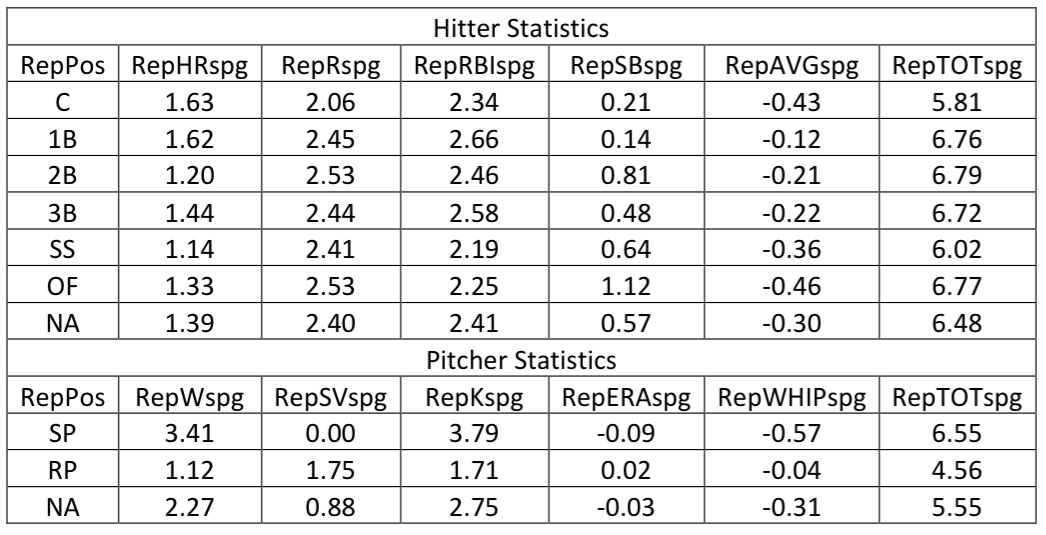
Now that we’ve defined replacement level for each position, we can calculate the standings points gained in each stat category that we might expect to be able to pick up off the waiver wire for a given position. We determined each position’s replacement level standing points gained for each category by taking the local average around replacement level, taking the two players just above and below replacement level. This is shown below for catcher’s replacement level runs standing points gained in a 10-team format. Values for each position’s replacement level standing points gained in each category of a 5×5 rotisserie 10-team format is shown below in Table 3 (RepPos of NA is used to account for players lacking position information, where Repspg in each category was taken as average of all positions).
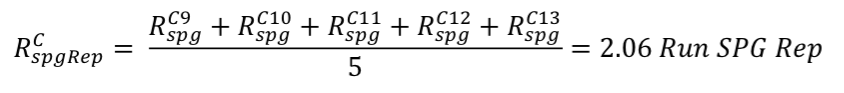
Table 3: Replacement Level SPG by Statistic and Position (10-Team Roto Scoring)
Performing this calculation for each statistic and position allows us to compare each player’s standing points gained in each category to that of a replacement player, i.e. his value above replacement. We show this calculation taking Buster Posey’s projected 69 R, good for 2.79 Rspg, as our example to compare against a replacement catcher.
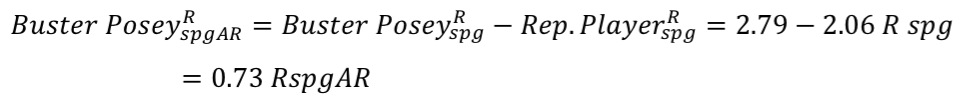 By again summing over every stat category we can obtain each players total standing points gained above replacement, which we’ll refer to by TOTspgAR. This is illustrated below, again taking Buster Posey as our example.
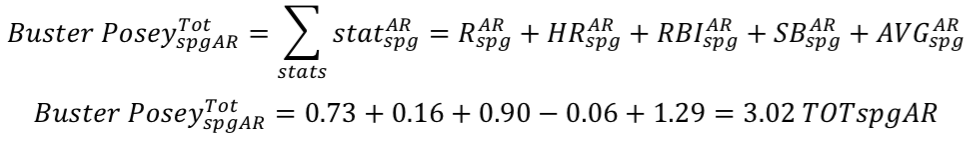 We now have a single metric measuring each player’s total standing points gained above his hypothetical replacement, and this is the quantity we should base our draft decisions around.
Points Leagues
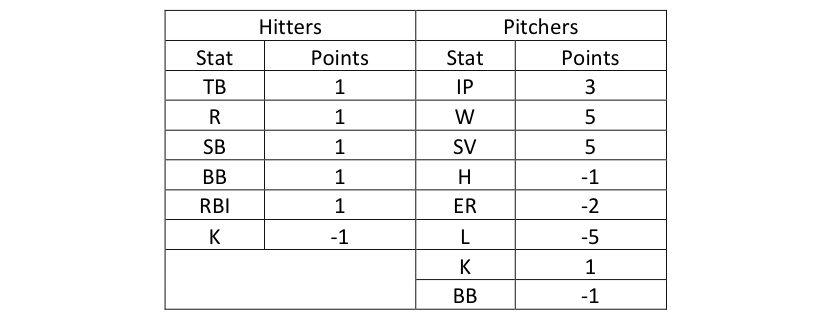
Points leagues, an alternative scoring system for fantasy baseball, present us with a simpler analysis to determine each player’s comparative worth [16]. Rather than having to determine how valuable each type of statistic is, there is only one thing that counts: Points. In order to account for position scarcity, replacement level must be determined and accounted for, in the same fashion as above for rotisserie scoring. The roster settings and thus replacement levels used in our analysis are the same as used above, while the points scoring settings are shown below in Table 4.
Table 4: Standard Points League Scoring Settings
Draftsheets
Special Request (AL-only 4×4 10 Team no R or K) : 4x4ALonly10Team
The Draft Sheets attached should be fairly self-explanatory, though we’ll explain what all the data means and where it came from. They are sorted by either total standing points gained above replacement (TOTspgAR) or total fantasy points above replacement (TOTFPtsAR), depending on the scoring type.
Take note that each draft sheet’s value above replacement transitions from positive to negative values as you cross the “draftable” threshold, i.e. “The Wandy Line” (251 for 10-team leagues and 301 for 12-team). The draftable threshold on each sheet is highlighted in red, and the bordering indicates the projected round structure of a snake-style draft, that is a non-auction draft.
If performing this modeling yourself, you should check the player values around the draftable threshold to see if you screwed up, if it doesn’t go from positive to negative near the correct threshold, start debugging.
- nameLast : Not going to explain…
- nameFirst : Nor this.
- teamID : Team info was taken from Zips projections, then converted to Lahman Database’s format
- ESPNPos : Position eligibility according to ESPN Projections
- YahooPos : Position eligibility according to Yahoo Projections
- Hand : Player’s handedness (L, R, or B for switch hitters). Taken from Zips projections. No we didn’t accommodate switch pitchers [17].
- Age : How many trips around the sun the player has experienced. Taken from Zips.
- ESPN : Ranking in ESPN’s Top 300 players (if available) [18]
- Yahoo : Ranking according to Yahoo Projections (if available)
- ESPNKp : Ranking according to ESPN’s Tristan Cockcroft’s Keeper Rankings (if available) [19]
- ESPNPosRnk : ESPN’s position ranking (only available for players that appear in the ESPN Top 300 rankings)
- SPGPosRnk (FPtsPosRnk) : Position rank according to TOTspgAR or TOTFPtsAR model
- TOTspgAR (TOTFptsAR) : ….you should reread the above.
- Statistics Projected by Duffy Model
o Rotoisserie Format
- Hitting Stats (H, R, RBI, SB, AVG)
- Pitching Stats (W, SV, K, ERA, WHIP)
o Points Format
- Hitting Stats (TB, R, RBI, SB, BB, K, TOTFPts)
- Pitching Stats (IP, W, SV, H, K, BB, ER, TOTFPts)
R Coding
I only recently began teaching myself how to code in R, so I’m sure there are better ways to go about a lot of this, and any suggestions are more than welcomed.
Concluding Remarks
Although we think we’ve put together a pretty good model, it is by no means perfect. When determining replacement level this model requires defining a single position for each player and it has trouble accounting for multi-position eligibility, though in truth each player should be judged as the “weakest hitting” position they’re eligible at [20]. This becomes difficult to incorporate, and somewhat subjective as the “weakest” hitting position is affected by the setting of replacement level, so we’ve simply used the positions listed by Zips in our modeling. Therefore, when valuing uber-utility men Ben Zobrist or Josh Harrison, you may want to make note of their Zips position, as well as where they are eligible in your league, and potentially adjust their ranking accordingly. In addition, in order to define a position for DH’s, I’ve lumped them in with the 1B, though this is a relatively minor issue as only a handful of DH’s are relevant anyway.
The standing points gained model used here has an additional oversimplification. It has assumed that the stats a player accrues are solely used to increase the team’s standing points, which is not entirely true [21]. Each stat category has a varying amount of stats that must be accrued simply to obtain last place (remember that y-intercept from our linear regression?); only after achieving last place do additional stats contribute to standing points in the way we’ve assumed.
We obviously were not the first to try to quantitatively determine fantasy value above replacement, such as this and this, and we’d be seriously remiss if we didn’t mention Tanner Bell, on whose work this model was largely based [22-24,1]. I still can’t figure out how he does this stuff in Excel though.
As the projection system used here is compiled from 7 sources, each of which only update their projections occasionally, the response time of our rankings to players with recently shifting playing time expectations is slow. Put simply, players such as Cliff Lee, Yu Darvish and Marcus Stroman are all projected to be pitching this year in these rankings, to put it mildly, it doesn’t really look like that will happen and I can’t really suggest you should be drafting any of them [25].
Although I don’t believe this model is 100% mathematically rigorous based on the discussion points above, it does possess a certain simplicity and common sense approach that appeals to me as an engineer. Generally speaking, don’t draft in a vacuum, adjust these rankings as you see fit, because if you didn’t it’d be our team not yours.
References
- Bell, T. (2013, March 22) Create Your Own Fantasy Baseball Rankings: Part 5 – Understanding Standings Gain Points. Retrieved from http://www.smartfantasybaseball.com/2013/03/create-your-own-fantasy-baseball-rankings-part-5-understanding-standings-gain-points/
- ESPN Stats & Info (2015, March 01) Sortable 2015 Projections (Hitters and Pitchers). Retrieved from http://games.espn.go.com/flb/tools/projections?
- Yahoo Fantasy Sports (2015, February 21) 2015 Projections (Hitters and Pitchers). Retrieved from http://baseball.fantasysports.yahoo.com/b1/90803/players?&sort=OR&sdir=1&status=A&pos=B&stat1=S_PSR&jsenabled=1
- CBS Sports Fantasy Baseball (2015, March 01) 2015 Projections (Hitters and Pitchers). Retrieved from http://fantasynews.cbssports.com/fantasybaseball/stats/sortable/cbs/1B/season/standard/projections
- Steamer Projections (2015, March 01) 2015 Projections (Hitters and Pitchers). Retrieved from http://www.fangraphs.com/projections.aspx?pos=all&stats=bat&type=steamer&team=0&players=0
- Razzball Projections (2015, March 01) 2015 Projections (Hitters and Pitchers). Retrieved from http://razzball.com/steamer-hitter-projections/
- Szymborski, D. (2015, March 01) 2015 Projections (Hitters and Pitchers). Retrieves from https://twitter.com/dszymborski/status/569662643813920768
- Davenport, C. (2015, March 01) 2015 Major League Projections (Hitters and Pitchers). Retrieved from http://claydavenport.com/projections/PROJHOME.shtml
- TG Fantasy Baseball (2015, March 01) 2015 Fantasy Baseball Projections (Hitters and Pitchers). Retrieved from http://www.letsplay2.com/baseball/projections.cfm
- Carter, S.C. (2015, March 01) 99 Problems. Retrieved from https://www.youtube.com/watch?v=WwoM5fLITfk
- Cockcroft, T.H. (2015, March 01) Inside the Projections Process. Retrieved from http://espn.go.com/fantasy/baseball/story/_/page/mlbdk2k15_projectionstalk/how-fantasy-baseball-projections-calculated-how-best-use-them
- ESPN Stats & Info (2015, March 01) Kolten Wong. Retrieved from http://espn.go.com/mlb/player/_/id/32061/kolten-wong
- Yahoo Sports (2015, March 01) Rotisserie (Roto) Scoring System Overview. Retrieved from https://help.yahoo.com/kb/fantasy-baseball/rotisserie-roto-scoring-system-overview-sln6187.html?impressions=true
- Grey (2015, March 01) Stats Needed to Win Your Fantasy Baseball League. Retrieved from http://razzball.com/stats-needed-to-win-your-fantasy-baseball-league/
- Berry, M. (2011, April 27) The Wandy Line. Retrieved from http://sports.espn.go.com/fantasy/baseball/flb/story?page=tmr110421
- ESPN Stats & Info (2015, March 01) Scoring Formats. Retrieved from http://games.espn.go.com/flb/resources/help/content?name=scoring-formats
- Wikipedia (2015, March 01) Pat Venditte. Retrieved from http://en.wikipedia.org/wiki/Pat_Venditte
- ESPN Stats & Info (2015, March 01) 2015 Fantasy Baseball Roto Top 300. Retrieved from http://espn.go.com/fantasy/baseball/story/_/page/mlbdk2k15_ranks_300/2015-fantasy-baseball-player-roto-rankings-top-300
- Cockcroft, T.H. (2015, March 13) Top 250 Keeper League Rankings. Retrieved from http://espn.go.com/fantasy/baseball/story/_/page/mlbdk2k15_keepergrid/2015-top-250-fantasy-baseball-keeper-rankings
- Bell, T. (2013, December 26) A Warning About Calculating Replacement Level. Retrieved from http://www.smartfantasybaseball.com/2013/12/a-warning-about-calculating-replacement-level/
- Zola, T. (2010) A Discussion of Standing Gains Points Theory: The Epiphany. Retrieved from http://www.mastersball.com/products/SGP%20Theory%202010.pdf
- Sanders, Z. (2011, October 17) Fantasy Value Above Replacement: New and Improved! Retrieved from http://www.fangraphs.com/fantasy/basebal-fantasy-value-above-replacement/
- Zola, T. and Leibowitz, R. (2015 March 01) Player Valuation. Retrieved from http://www.mastersball.com/products/Player%20Valuation.pdf
- Bell, T. (2015, March 01) Smart Fantasy Baseball. Retrieved from http://www.smartfantasybaseball.com/
- Cockcroft, T.H. (2015 March 14) Darvish, Stroman, Lee Shift in Ranks. Retrieved from http://espn.go.com/fantasy/baseball/story/_/page/mlbdk2k15_rankschanges150313/yu-darvish-marcus-stroman-cliff-lee-denard-span-notable-movers-rankings
4 thoughts on “Using Projection Models for 2015 Fantasy Baseball Drafts”
Is there any way to quickly adjust this sheet to reflect AL only, and 4×4?
Would it work if I just subtracted the SPG from the excluded categories (runs, K)?
Justin
TL;DR: No, this would get pretty complicated to perform without going into the code (which I’m still trying to figure out the best way to post). Email/tweet me what the settings in terms of roster/scoring/number of teams are and I’ll hook up a sheet for you
As to the 4×4 change: You’d have to subtract the standing points gained above replacement (spgAR) for the categories you’re neglecting, not just the SPG. Obviously this is a different computation for each player based on their position.
As to AL only: I knew this was going to come up eventually. Changing to an AL/NL only format would drastically redefine what replacement level ability is, and would require subsetting the data from the start, i.e. only ranking AL or NL players.
Both of these are super easy changes to make to the code, get in touch and I can provide the adjusted draftsheet to you.
Doug
Added what I think you were requesting in terms an AL-only 10 Team Draft Sheet (Hitting Stats: RBI, HR, SB, AVG; Pitching Stats: W, SV, ERA, WHIP).
It appears that replacement hitting ability decreases faster than replacement pitching ability, when using only AL players. Hitters seem to have increased in value versus the mixed (AL and NL) format, while pitchers have decreased in value.
Doug
Love the work you guys do! Are you coming out with a 2016 MLB Projection Model?
Keep up the great work!
Jonathan Dotzko
Comments are closed.